
 Yahoo Finance
 Do You Like Parex Resources Inc. (TSE:PXT) At This P/E Ratio?

Today, we'll introduce the concept of the P/E ratio for those who are learning about investing. We'll show how you can use Parex Resources Inc.'s (TSE:PXT) P/E ratio to inform your assessment of the investment opportunity. Parex Resources has a price to earnings ratio of 7.83, based on the last twelve months. In other words, at today's prices, investors are paying CA$7.83 for every CA$1 in prior year profit.
See our latest analysis for Parex Resources
How Do You Calculate A P/E Ratio?
The formula for price to earnings is:
Price to Earnings Ratio = Price per Share (in the reporting currency) ÷ Earnings per Share (EPS)
Or for Parex Resources:
P/E of 7.83 = CA$15.45 (Note: this is the share price in the reporting currency, namely, USD ) ÷ CA$1.97 (Based on the year to September 2019.)
Is A High Price-to-Earnings Ratio Good?
A higher P/E ratio implies that investors pay a higher price for the earning power of the business. All else being equal, it's better to pay a low price -- but as Warren Buffett said, 'It's far better to buy a wonderful company at a fair price than a fair company at a wonderful price.
How Does Parex Resources's P/E Ratio Compare To Its Peers?
The P/E ratio essentially measures market expectations of a company. We can see in the image below that the average P/E (10.5) for companies in the oil and gas industry is higher than Parex Resources's P/E.
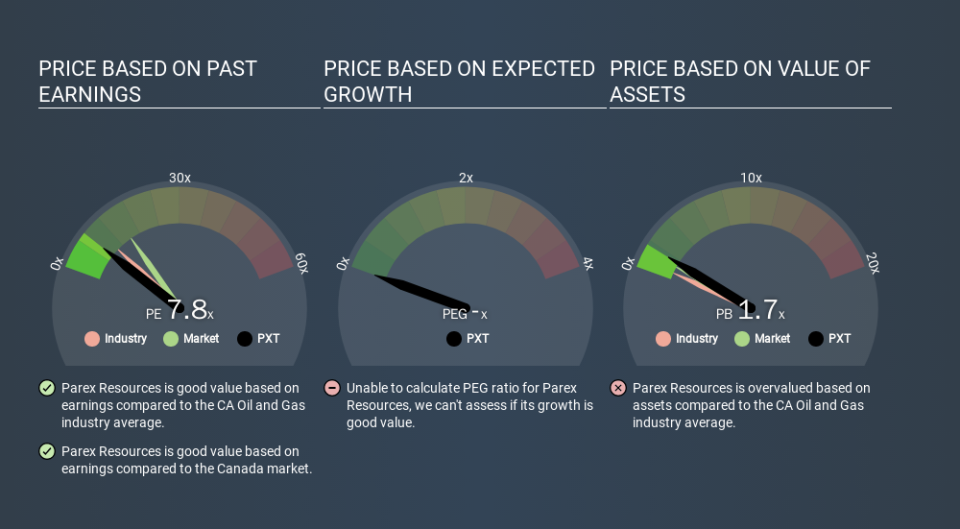
Its relatively low P/E ratio indicates that Parex Resources shareholders think it will struggle to do as well as other companies in its industry classification. Since the market seems unimpressed with Parex Resources, it's quite possible it could surprise on the upside. It is arguably worth checking if insiders are buying shares, because that might imply they believe the stock is undervalued.
How Growth Rates Impact P/E Ratios
Probably the most important factor in determining what P/E a company trades on is the earnings growth. Earnings growth means that in the future the 'E' will be higher. And in that case, the P/E ratio itself will drop rather quickly. And as that P/E ratio drops, the company will look cheap, unless its share price increases.
Parex Resources's earnings per share fell by 24% in the last twelve months. But over the longer term (5 years) earnings per share have increased by 17%.
A Limitation: P/E Ratios Ignore Debt and Cash In The Bank
Don't forget that the P/E ratio considers market capitalization. In other words, it does not consider any debt or cash that the company may have on the balance sheet. Hypothetically, a company could reduce its future P/E ratio by spending its cash (or taking on debt) to achieve higher earnings.
Such spending might be good or bad, overall, but the key point here is that you need to look at debt to understand the P/E ratio in context.
So What Does Parex Resources's Balance Sheet Tell Us?
With net cash of US$350m, Parex Resources has a very strong balance sheet, which may be important for its business. Having said that, at 16% of its market capitalization the cash hoard would contribute towards a higher P/E ratio.
The Verdict On Parex Resources's P/E Ratio
Parex Resources trades on a P/E ratio of 7.8, which is below the CA market average of 15.1. The recent drop in earnings per share would make investors cautious, but the net cash position means the company has time to improve: if so, the low P/E could be an opportunity.
Investors have an opportunity when market expectations about a stock are wrong. If it is underestimating a company, investors can make money by buying and holding the shares until the market corrects itself. So this free report on the analyst consensus forecasts could help you make a master move on this stock.
Of course, you might find a fantastic investment by looking at a few good candidates. So take a peek at this free list of companies with modest (or no) debt, trading on a P/E below 20.
If you spot an error that warrants correction, please contact the editor at editorial-team@simplywallst.com. This article by Simply Wall St is general in nature. It does not constitute a recommendation to buy or sell any stock, and does not take account of your objectives, or your financial situation. Simply Wall St has no position in the stocks mentioned.
We aim to bring you long-term focused research analysis driven by fundamental data. Note that our analysis may not factor in the latest price-sensitive company announcements or qualitative material. Thank you for reading.
