
 Yahoo Finance
 Paramount Resources'(TSE:POU) Share Price Is Down 83% Over The Past Three Years.
Over the last month the Paramount Resources Ltd. (TSE:POU) has been much stronger than before, rebounding by 37%. But that doesn't change the fact that the returns over the last three years have been stomach churning. In that time the share price has melted like a snowball in the desert, down 83%. Arguably, the recent bounce is to be expected after such a bad drop. The thing to think about is whether the business has really turned around.
We really hope anyone holding through that price crash has a diversified portfolio. Even when you lose money, you don't have to lose the lesson.
View our latest analysis for Paramount Resources
Because Paramount Resources made a loss in the last twelve months, we think the market is probably more focussed on revenue and revenue growth, at least for now. When a company doesn't make profits, we'd generally expect to see good revenue growth. That's because fast revenue growth can be easily extrapolated to forecast profits, often of considerable size.
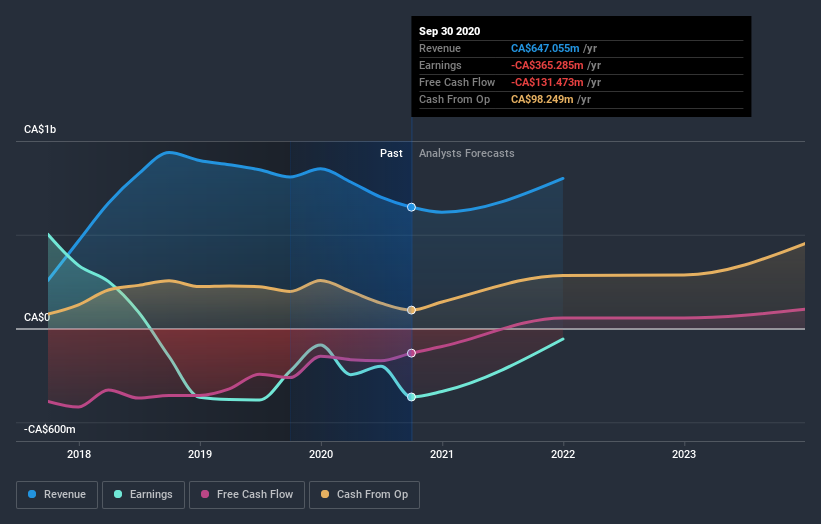
Over three years, Paramount Resources grew revenue at 11% per year. That's a fairly respectable growth rate. So it seems unlikely the 22% share price drop (each year) is entirely about the revenue. It could be that the losses were much larger than expected. This is exactly why investors need to diversify - even when a loss making company grows revenue, it can fail to deliver for shareholders.
The company's revenue and earnings (over time) are depicted in the image below (click to see the exact numbers).
This free interactive report on Paramount Resources' balance sheet strength is a great place to start, if you want to investigate the stock further.
A Different Perspective
Investors in Paramount Resources had a tough year, with a total loss of 41%, against a market gain of about 2.1%. However, keep in mind that even the best stocks will sometimes underperform the market over a twelve month period. Unfortunately, last year's performance may indicate unresolved challenges, given that it was worse than the annualised loss of 10% over the last half decade. Generally speaking long term share price weakness can be a bad sign, though contrarian investors might want to research the stock in hope of a turnaround. It's always interesting to track share price performance over the longer term. But to understand Paramount Resources better, we need to consider many other factors. Consider for instance, the ever-present spectre of investment risk. We've identified 3 warning signs with Paramount Resources , and understanding them should be part of your investment process.
Of course Paramount Resources may not be the best stock to buy. So you may wish to see this free collection of growth stocks.
Please note, the market returns quoted in this article reflect the market weighted average returns of stocks that currently trade on CA exchanges.
This article by Simply Wall St is general in nature. It does not constitute a recommendation to buy or sell any stock, and does not take account of your objectives, or your financial situation. We aim to bring you long-term focused analysis driven by fundamental data. Note that our analysis may not factor in the latest price-sensitive company announcements or qualitative material. Simply Wall St has no position in any stocks mentioned.
Have feedback on this article? Concerned about the content? Get in touch with us directly. Alternatively, email editorial-team@simplywallst.com.
