
 Yahoo Finance
 Palomar Holdings' (NASDAQ:PLMR) earnings growth rate lags the 32% CAGR delivered to shareholders
We think all investors should try to buy and hold high quality multi-year winners. And we've seen some truly amazing gains over the years. Just think about the savvy investors who held Palomar Holdings, Inc. (NASDAQ:PLMR) shares for the last five years, while they gained 305%. If that doesn't get you thinking about long term investing, we don't know what will. It's also good to see the share price up 29% over the last quarter.
While this past week has detracted from the company's five-year return, let's look at the recent trends of the underlying business and see if the gains have been in alignment.
See our latest analysis for Palomar Holdings
While markets are a powerful pricing mechanism, share prices reflect investor sentiment, not just underlying business performance. By comparing earnings per share (EPS) and share price changes over time, we can get a feel for how investor attitudes to a company have morphed over time.
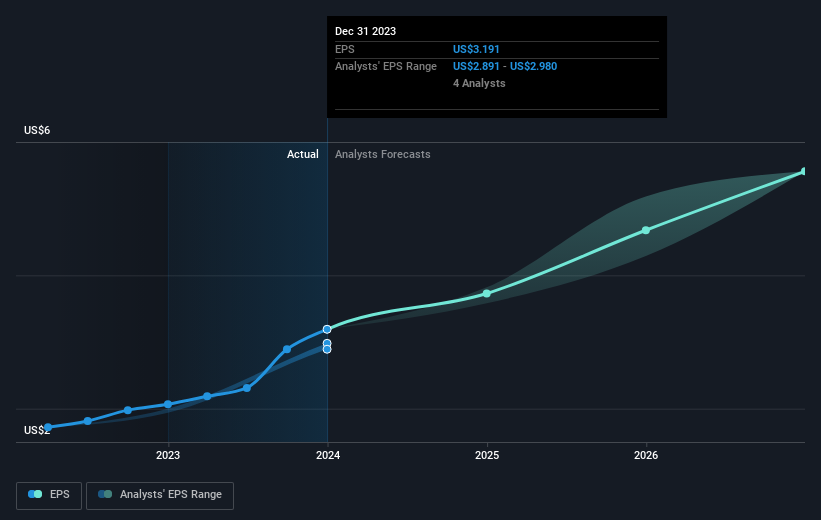
During five years of share price growth, Palomar Holdings achieved compound earnings per share (EPS) growth of 24% per year. This EPS growth is slower than the share price growth of 32% per year, over the same period. This suggests that market participants hold the company in higher regard, these days. That's not necessarily surprising considering the five-year track record of earnings growth.
The image below shows how EPS has tracked over time (if you click on the image you can see greater detail).
It's good to see that there was some significant insider buying in the last three months. That's a positive. On the other hand, we think the revenue and earnings trends are much more meaningful measures of the business. Dive deeper into the earnings by checking this interactive graph of Palomar Holdings' earnings, revenue and cash flow.
A Different Perspective
We're pleased to report that Palomar Holdings shareholders have received a total shareholder return of 43% over one year. Since the one-year TSR is better than the five-year TSR (the latter coming in at 32% per year), it would seem that the stock's performance has improved in recent times. Given the share price momentum remains strong, it might be worth taking a closer look at the stock, lest you miss an opportunity. While it is well worth considering the different impacts that market conditions can have on the share price, there are other factors that are even more important. Even so, be aware that Palomar Holdings is showing 1 warning sign in our investment analysis , you should know about...
If you like to buy stocks alongside management, then you might just love this free list of companies. (Hint: insiders have been buying them).
Please note, the market returns quoted in this article reflect the market weighted average returns of stocks that currently trade on American exchanges.
Have feedback on this article? Concerned about the content? Get in touch with us directly. Alternatively, email editorial-team (at) simplywallst.com.
This article by Simply Wall St is general in nature. We provide commentary based on historical data and analyst forecasts only using an unbiased methodology and our articles are not intended to be financial advice. It does not constitute a recommendation to buy or sell any stock, and does not take account of your objectives, or your financial situation. We aim to bring you long-term focused analysis driven by fundamental data. Note that our analysis may not factor in the latest price-sensitive company announcements or qualitative material. Simply Wall St has no position in any stocks mentioned.
