
 Yahoo Finance
 S&P Global (SPGI) Q1 Earnings Beat Estimates, Surge Y/Y
S&P Global Inc. SPGI reported impressive first-quarter 2023 results, wherein both earnings and revenues beat the Zacks Consensus Estimate.
Adjusted earnings per share (excluding 68 cents from non-recurring items) of $3.15 beat the Zacks Consensus Estimate by 7.9% and rose 9% year over year. Revenues of $3.16 billion surpassed the Zacks Consensus Estimate by 3.6% and improved 32.3% year over year, backed by the inclusion of IHS Markit businesses.
Let’s check out the numbers in detail.
S&P Global Inc. Price, Consensus and EPS Surprise
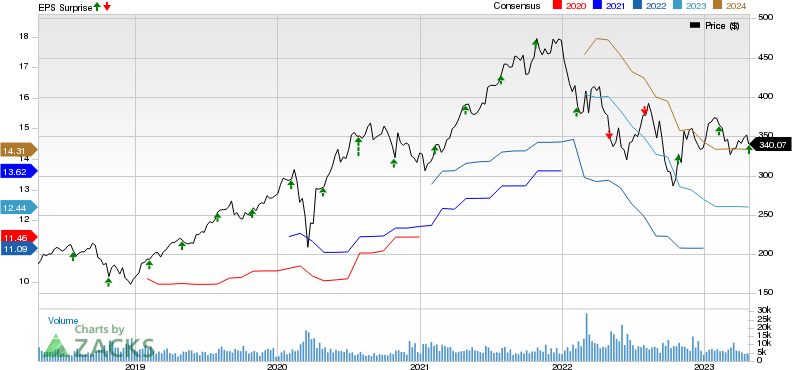
S&P Global Inc. price-consensus-eps-surprise-chart | S&P Global Inc. Quote
Segmental Revenues
Ratings’ revenues decreased 5% year over year to $824 million. Transaction’s revenues fell 6% year over year to $379 million due to a decrease in debt issuance. Revenues from Non-transaction dipped 4% year over year to $445 million due to lower initial Issuer Credit Rating revenues and Rating Evaluation Services revenues.
Market Intelligence segment’s adjusted revenues were up 47% year over year to $1.07 billion, primarily driven by the inclusion of IHS Markit revenues and Data & Advisory Solutions revenue.
Commodity Insights’ revenues increased 40% to $508 million in the first quarter of 2023, primarily driven by the inclusion of IHS Markit, Advisory & Transactional Services, as well as strength in Price Assessments and Energy & Resources Data & Insights.
S&P Dow Jones S&P Dow Jones Indices’ adjusted revenues grew 6% to $341 million, driven by the inclusion of IHS Markit and strong growth in Exchange-Traded Derivatives.
Operating Results
Segment-wise, Ratings’ adjusted operating profit decreased 6% to $480 million and adjusted operating profit margin declined 80 bps to 58.3%.
Market Intelligence’s adjusted operating profit increased 16% to $343 million and adjusted pro-forma operating profit margin gained 300 bps to 32%.
Commodity Insights’ adjusted operating profit improved 17% to $234 million and adjusted operating profit margin expanded 310 bps to 46.1%.
S&P Dow Jones Indices’ adjusted operating profit rose 4% to $245 million. However, adjusted operating profit margin decreased 250 bps to 71.8%.
Balance Sheet and Cash Flow
S&P Global exited first-quarter 2023 with cash, cash equivalents and restricted cash of $1.4 billion compared with $1.3 billion at the end of the prior quarter. Long-term debt was $10.72 billion compared with $10.73 billion at the end of fourth-quarter 2022.
SPGI generated $594 million of cash from operating activities in the reported quarter. Capital expenditures were $28 million. Free cash flow was $488 million.
During the first quarter of 2023, S&P Global returned more than $790 million to its shareholders through a combination of $500 million in the form of an accelerated share repurchase agreement and $290 million of cash dividends.
Currently, S&P Global carries a Zacks Rank #3 (Hold). You can see the complete list of today’s Zacks #1 Rank (Strong Buy) stocks here.
2023 EPS Outlook
Adjusted EPS is expected in the range of $12.35-$12.55. The midpoint of the guided range ($12.45) lies above the Zacks Consensus Estimate of $12.44.
Non-GAAP adjusted free cash flow (excluding certain items) is now expected to be between $4.2 billion and $4.3 billion (prior view: $4.3 to $4.4 billion).
Recent Earnings Snapshots of Some Service Providers
Omnicom OMC reported better-than-expected first-quarter 2023 results.
OMC’s earnings of $1.56 per share beat the Zacks Consensus Estimate by 13% and our estimate by 11.4%. EPS increased 12.2% year over year. Total revenues of $3.4 billion surpassed the consensus estimate by 2.3% and our estimate by 1.4%. The top line increased 1% year over year.
Equifax EFX also reported a beat on both counts in its first-quarter 2023 results.
EFX’s adjusted earnings of $1.43 per share beat the consensus mark by 4.4%. However, the bottom line declined 35.6% from the year-ago figure. Total revenues of $1.3 billion surpassed the consensus estimate by 1.5% but decreased 4.5% year over year.
ManpowerGroup MAN reported lower-than-expected first-quarter 2023 results.
MAN’s adjusted earnings of $1.61 per share lagged the consensus mark by 0.6% but matched our estimate. Revenues of $4.8 billion missed the consensus mark by 1.3% and our estimate by a slight margin. The top line decreased 7.6% year over year.
Want the latest recommendations from Zacks Investment Research? Today, you can download 7 Best Stocks for the Next 30 Days. Click to get this free report
ManpowerGroup Inc. (MAN) : Free Stock Analysis Report
Omnicom Group Inc. (OMC) : Free Stock Analysis Report
Equifax, Inc. (EFX) : Free Stock Analysis Report
S&P Global Inc. (SPGI) : Free Stock Analysis Report
