
 Yahoo Finance
 Has Oxford Industries, Inc. (NYSE:OXM) Stock's Recent Performance Got Anything to Do With Its Financial Health?
Oxford Industries' (NYSE:OXM) stock is up by 9.6% over the past three months. As most would know, long-term fundamentals have a strong correlation with market price movements, so we decided to look at the company's key financial indicators today to determine if they have any role to play in the recent price movement. Particularly, we will be paying attention to Oxford Industries' ROE today.
Return on Equity or ROE is a test of how effectively a company is growing its value and managing investors’ money. In simpler terms, it measures the profitability of a company in relation to shareholder's equity.
See our latest analysis for Oxford Industries
How Do You Calculate Return On Equity?
The formula for return on equity is:
Return on Equity = Net Profit (from continuing operations) ÷ Shareholders' Equity
So, based on the above formula, the ROE for Oxford Industries is:
12% = US$57m ÷ US$474m (Based on the trailing twelve months to July 2021).
The 'return' is the profit over the last twelve months. So, this means that for every $1 of its shareholder's investments, the company generates a profit of $0.12.
What Has ROE Got To Do With Earnings Growth?
So far, we've learned that ROE is a measure of a company's profitability. We now need to evaluate how much profit the company reinvests or "retains" for future growth which then gives us an idea about the growth potential of the company. Assuming everything else remains unchanged, the higher the ROE and profit retention, the higher the growth rate of a company compared to companies that don't necessarily bear these characteristics.
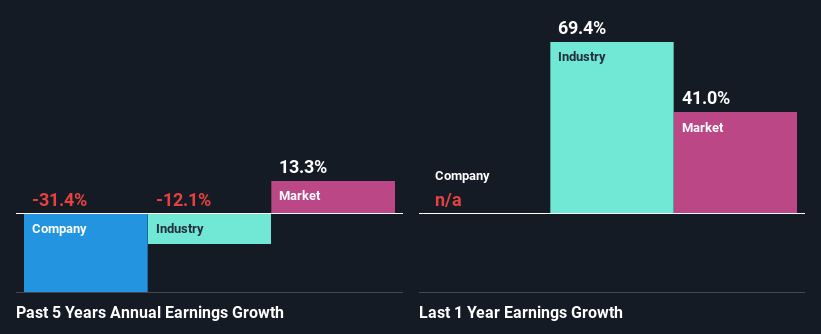
A Side By Side comparison of Oxford Industries' Earnings Growth And 12% ROE
At first glance, Oxford Industries seems to have a decent ROE. Yet, the fact that the company's ROE is lower than the industry average of 16% does temper our expectations. Moreover, Oxford Industries' net income shrunk at a rate of 31%over the past five years. Not to forget, the company does have a high ROE to begin with, just that it is lower than the industry average. Therefore, the shrinking earnings could be the result of other factors. For example, it could be that the company has a high payout ratio or the business has allocated capital poorly, for instance.
As a next step, we compared Oxford Industries' performance with the industry and found thatOxford Industries' performance is depressing even when compared with the industry, which has shrunk its earnings at a rate of 12% in the same period, which is a slower than the company.
Earnings growth is an important metric to consider when valuing a stock. The investor should try to establish if the expected growth or decline in earnings, whichever the case may be, is priced in. This then helps them determine if the stock is placed for a bright or bleak future. Has the market priced in the future outlook for OXM? You can find out in our latest intrinsic value infographic research report.
Is Oxford Industries Making Efficient Use Of Its Profits?
Looking at its three-year median payout ratio of 29% (or a retention ratio of 71%) which is pretty normal, Oxford Industries' declining earnings is rather baffling as one would expect to see a fair bit of growth when a company is retaining a good portion of its profits. It looks like there might be some other reasons to explain the lack in that respect. For example, the business could be in decline.
Additionally, Oxford Industries has paid dividends over a period of at least ten years, which means that the company's management is determined to pay dividends even if it means little to no earnings growth. Our latest analyst data shows that the future payout ratio of the company over the next three years is expected to be approximately 29%. Still, forecasts suggest that Oxford Industries' future ROE will rise to 21% even though the the company's payout ratio is not expected to change by much.
Summary
In total, it does look like Oxford Industries has some positive aspects to its business. Although, we are disappointed to see a lack of growth in earnings even in spite of a moderate ROE and and a high reinvestment rate. We believe that there might be some outside factors that could be having a negative impact on the business. With that said, we studied the latest analyst forecasts and found that while the company has shrunk its earnings in the past, analysts expect its earnings to grow in the future. To know more about the company's future earnings growth forecasts take a look at this free report on analyst forecasts for the company to find out more.
This article by Simply Wall St is general in nature. We provide commentary based on historical data and analyst forecasts only using an unbiased methodology and our articles are not intended to be financial advice. It does not constitute a recommendation to buy or sell any stock, and does not take account of your objectives, or your financial situation. We aim to bring you long-term focused analysis driven by fundamental data. Note that our analysis may not factor in the latest price-sensitive company announcements or qualitative material. Simply Wall St has no position in any stocks mentioned.
Have feedback on this article? Concerned about the content? Get in touch with us directly. Alternatively, email editorial-team (at) simplywallst.com.
