
 Yahoo Finance
 Is Overstock.com, Inc.’s (NASDAQ:OSTK) CEO Pay Fair?

In 1999 Patrick Byrne was appointed CEO of Overstock.com, Inc. (NASDAQ:OSTK). This report will, first, examine the CEO compensation levels in comparison to CEO compensation at companies of similar size. Then we’ll look at a snap shot of the business growth. And finally we will reflect on how common stockholders have fared in the last few years, as a secondary measure of performance. The aim of all this is to consider the appropriateness of CEO pay levels.
See our latest analysis for Overstock.com
Want to help shape the future of investing tools and platforms? Take the survey and be part of one of the most advanced studies of stock market investors to date.
How Does Patrick Byrne’s Compensation Compare With Similar Sized Companies?
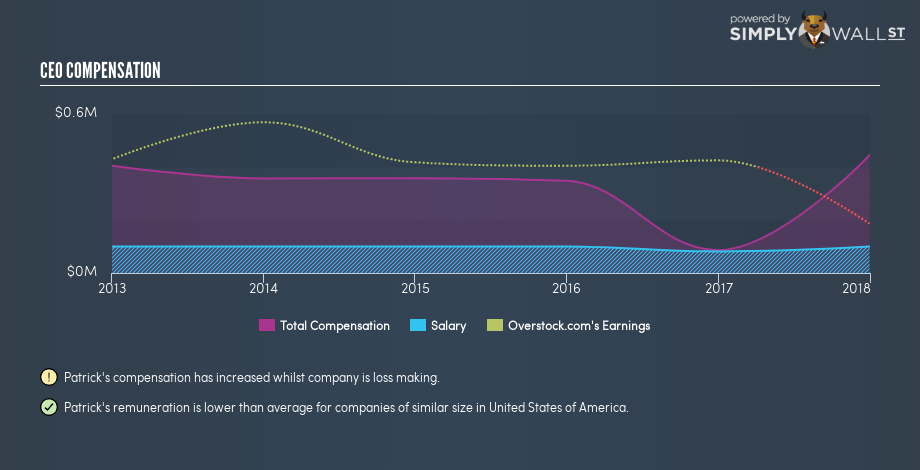
Our data indicates that Overstock.com, Inc. is worth US$458m, and total annual CEO compensation is US$445k. (This number is for the twelve months until 2017). While we always look at total compensation first, we note that the salary component is less, at US$100k. We examined companies with market caps from US$200m to US$800m, and discovered that the median CEO compensation of that group was US$1.6m.
This would give shareholders a good impression of the company, since most similar size companies have to pay more, leaving less for shareholders. However, before we heap on the praise, we should delve deeper to understand business performance.
The graphic below shows how CEO compensation at Overstock.com has changed from year to year.
Is Overstock.com, Inc. Growing?
Over the last three years Overstock.com, Inc. has shrunk its earnings per share by an average of 129% per year. The trailing twelve months of revenue was pretty much the same as the prior period.
Few shareholders would be pleased to read that earnings per share are lower over three years. And the flat revenue is seriously uninspiring. These factors suggest that the business performance wouldn’t really justify a high pay packet for the CEO.
You might want to check this free visual report on analyst forecasts for future earnings.
Has Overstock.com, Inc. Been A Good Investment?
Boasting a total shareholder return of 34% over three years, Overstock.com, Inc. has done well by shareholders. As a result, some may believe the CEO should be paid more than is normal for companies of similar size.
In Summary…
It looks like Overstock.com, Inc. pays its CEO less than similar sized companies.
Patrick Byrne receives relatively low remuneration compared to similar sized companies. And while the company isn’t growing earnings per share, total returns have been pleasing. So, while it would be nice to have EPS growth, on our analysis the CEO compensation is not an issue. CEO compensation is one thing, but it is also interesting to check if the CEO is buying or selling Overstock.com (free visualization of insider trades).
Or you might prefer gaze upon this detailed graph of past earnings, revenue and cash flow .
To help readers see past the short term volatility of the financial market, we aim to bring you a long-term focused research analysis purely driven by fundamental data. Note that our analysis does not factor in the latest price-sensitive company announcements.
The author is an independent contributor and at the time of publication had no position in the stocks mentioned. For errors that warrant correction please contact the editor at editorial-team@simplywallst.com.