
 Yahoo Finance
 Orvana Minerals (TSE:ORV) Is Doing The Right Things To Multiply Its Share Price
Finding a business that has the potential to grow substantially is not easy, but it is possible if we look at a few key financial metrics. In a perfect world, we'd like to see a company investing more capital into its business and ideally the returns earned from that capital are also increasing. Put simply, these types of businesses are compounding machines, meaning they are continually reinvesting their earnings at ever-higher rates of return. With that in mind, we've noticed some promising trends at Orvana Minerals (TSE:ORV) so let's look a bit deeper.
Return On Capital Employed (ROCE): What is it?
For those who don't know, ROCE is a measure of a company's yearly pre-tax profit (its return), relative to the capital employed in the business. Analysts use this formula to calculate it for Orvana Minerals:
Return on Capital Employed = Earnings Before Interest and Tax (EBIT) ÷ (Total Assets - Current Liabilities)
0.041 = US$4.2m ÷ (US$151m - US$47m) (Based on the trailing twelve months to June 2021).
Therefore, Orvana Minerals has an ROCE of 4.1%. In absolute terms, that's a low return, but it's much better than the Metals and Mining industry average of 2.3%.
View our latest analysis for Orvana Minerals
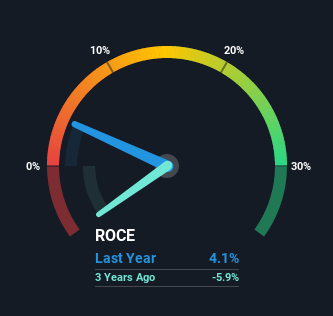
Historical performance is a great place to start when researching a stock so above you can see the gauge for Orvana Minerals' ROCE against it's prior returns. If you want to delve into the historical earnings, revenue and cash flow of Orvana Minerals, check out these free graphs here.
What Does the ROCE Trend For Orvana Minerals Tell Us?
It's great to see that Orvana Minerals has started to generate some pre-tax earnings from prior investments. While the business is profitable now, it used to be incurring losses on invested capital five years ago. In regards to capital employed, Orvana Minerals is using 23% less capital than it was five years ago, which on the surface, can indicate that the business has become more efficient at generating these returns. Orvana Minerals could be selling under-performing assets since the ROCE is improving.
For the record though, there was a noticeable increase in the company's current liabilities over the period, so we would attribute some of the ROCE growth to that. Essentially the business now has suppliers or short-term creditors funding about 31% of its operations, which isn't ideal. Keep an eye out for future increases because when the ratio of current liabilities to total assets gets particularly high, this can introduce some new risks for the business.
What We Can Learn From Orvana Minerals' ROCE
From what we've seen above, Orvana Minerals has managed to increase it's returns on capital all the while reducing it's capital base. Since the stock has only returned 9.5% to shareholders over the last five years, the promising fundamentals may not be recognized yet by investors. So with that in mind, we think the stock deserves further research.
On a separate note, we've found 2 warning signs for Orvana Minerals you'll probably want to know about.
While Orvana Minerals isn't earning the highest return, check out this free list of companies that are earning high returns on equity with solid balance sheets.
This article by Simply Wall St is general in nature. We provide commentary based on historical data and analyst forecasts only using an unbiased methodology and our articles are not intended to be financial advice. It does not constitute a recommendation to buy or sell any stock, and does not take account of your objectives, or your financial situation. We aim to bring you long-term focused analysis driven by fundamental data. Note that our analysis may not factor in the latest price-sensitive company announcements or qualitative material. Simply Wall St has no position in any stocks mentioned.
Have feedback on this article? Concerned about the content? Get in touch with us directly. Alternatively, email editorial-team (at) simplywallst.com.
