
 Yahoo Finance
 Orell Füssli AG (VTX:OFN) Stock's Been Sliding But Fundamentals Look Decent: Will The Market Correct The Share Price In The Future?
Orell Füssli (VTX:OFN) has had a rough three months with its share price down 2.0%. However, stock prices are usually driven by a company’s financials over the long term, which in this case look pretty respectable. Specifically, we decided to study Orell Füssli's ROE in this article.
Return on Equity or ROE is a test of how effectively a company is growing its value and managing investors’ money. In other words, it is a profitability ratio which measures the rate of return on the capital provided by the company's shareholders.
Check out our latest analysis for Orell Füssli
How Is ROE Calculated?
Return on equity can be calculated by using the formula:
Return on Equity = Net Profit (from continuing operations) ÷ Shareholders' Equity
So, based on the above formula, the ROE for Orell Füssli is:
8.7% = CHF12m ÷ CHF134m (Based on the trailing twelve months to December 2022).
The 'return' is the income the business earned over the last year. That means that for every CHF1 worth of shareholders' equity, the company generated CHF0.09 in profit.
What Is The Relationship Between ROE And Earnings Growth?
Thus far, we have learned that ROE measures how efficiently a company is generating its profits. Based on how much of its profits the company chooses to reinvest or "retain", we are then able to evaluate a company's future ability to generate profits. Assuming everything else remains unchanged, the higher the ROE and profit retention, the higher the growth rate of a company compared to companies that don't necessarily bear these characteristics.
A Side By Side comparison of Orell Füssli's Earnings Growth And 8.7% ROE
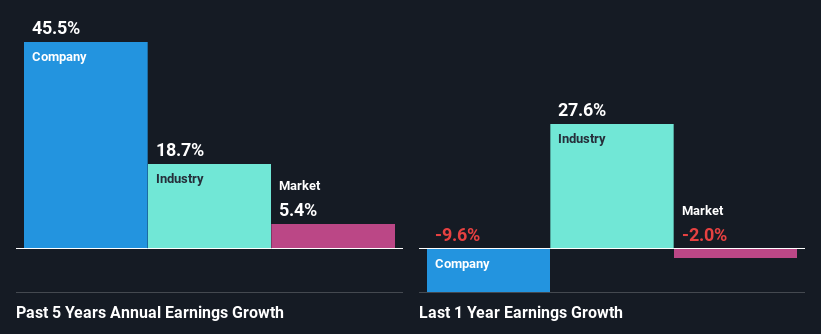
At first glance, Orell Füssli seems to have a decent ROE. Yet, the fact that the company's ROE is lower than the industry average of 11% does temper our expectations. However, we are pleased to see the impressive 46% net income growth reported by Orell Füssli over the past five years. We believe that there might be other aspects that are positively influencing the company's earnings growth. Such as - high earnings retention or an efficient management in place. However, not to forget, the company does have a decent ROE to begin with, just that it is lower than the industry average. So this certainly also provides some context to the high earnings growth seen by the company.
As a next step, we compared Orell Füssli's net income growth with the industry, and pleasingly, we found that the growth seen by the company is higher than the average industry growth of 11%.
The basis for attaching value to a company is, to a great extent, tied to its earnings growth. What investors need to determine next is if the expected earnings growth, or the lack of it, is already built into the share price. This then helps them determine if the stock is placed for a bright or bleak future. One good indicator of expected earnings growth is the P/E ratio which determines the price the market is willing to pay for a stock based on its earnings prospects. So, you may want to check if Orell Füssli is trading on a high P/E or a low P/E, relative to its industry.
Is Orell Füssli Using Its Retained Earnings Effectively?
The high three-year median payout ratio of 70% (implying that it keeps only 30% of profits) for Orell Füssli suggests that the company's growth wasn't really hampered despite it returning most of the earnings to its shareholders.
Moreover, Orell Füssli is determined to keep sharing its profits with shareholders which we infer from its long history of seven years of paying a dividend. Our latest analyst data shows that the future payout ratio of the company over the next three years is expected to be approximately 76%. As a result, Orell Füssli's ROE is not expected to change by much either, which we inferred from the analyst estimate of 7.9% for future ROE.
Summary
In total, it does look like Orell Füssli has some positive aspects to its business. Especially the substantial growth in earnings backed by a decent ROE. Despite the company reinvesting only a small portion of its profits, it still has managed to grow its earnings so that is appreciable. Having said that, the company's earnings growth is expected to slow down, as forecasted in the current analyst estimates. Are these analysts expectations based on the broad expectations for the industry, or on the company's fundamentals? Click here to be taken to our analyst's forecasts page for the company.
Have feedback on this article? Concerned about the content? Get in touch with us directly. Alternatively, email editorial-team (at) simplywallst.com.
This article by Simply Wall St is general in nature. We provide commentary based on historical data and analyst forecasts only using an unbiased methodology and our articles are not intended to be financial advice. It does not constitute a recommendation to buy or sell any stock, and does not take account of your objectives, or your financial situation. We aim to bring you long-term focused analysis driven by fundamental data. Note that our analysis may not factor in the latest price-sensitive company announcements or qualitative material. Simply Wall St has no position in any stocks mentioned.
Join A Paid User Research Session
You’ll receive a US$30 Amazon Gift card for 1 hour of your time while helping us build better investing tools for the individual investors like yourself. Sign up here
