
 Yahoo Finance
 OpenText Corp. (TSX:OTEX): Full-Year Results Review: Buy, Hold, or Sell?

Some investors ignore OpenText (TSX:OTEX)(NASDAQ:OTEX) because the company has an S&P credit rating of BB+, which is one notch below investment grade. However, the stock’s long-term performance speaks for itself.
In the last five- and 10-year periods, OpenText stock has greatly outperformed the Canadian market, using iShares S&P/TSX 60 Index Fund (TSX:XIU) as a proxy, and outperformed the NASDAQ.

OTEX data by YCharts – Five-year chart
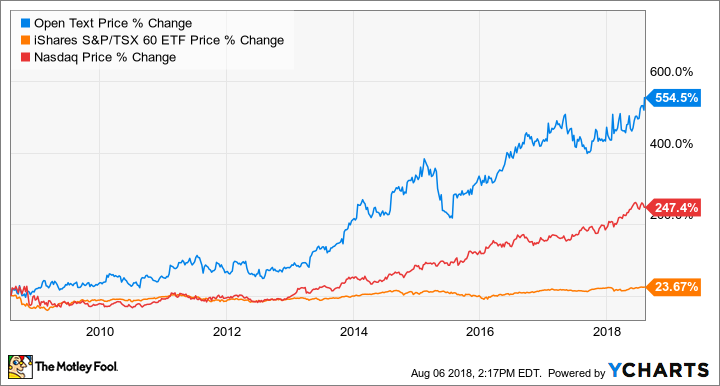
OTEX data by YCharts – 10-year chart
OpenText’s recent quarterly and full-year results pushed the stock higher. Let’s review the results.
OpenText’s fiscal Q4 results
Here are some key metrics compared to the same period in 2017:
Q4 fiscal 2017 | Q4 fiscal 2018 | Change | |
Total revenues | US$663.6 million | US$754.3 million | 13.7% |
Annual recurring revenues | US$471.4 million | US$534.6 million | 13.4% |
Diluted earnings per share | US$0.60 | US$0.72 | 20% |
Adjusted EBITDA | US$237 million | US$281.8 million | 18.9% |
Operating cash flows | US$102.5 million | US$205.5 million | 100.5% |
OpenText experiences stronger growth in certain quarters. Thus, it’s better to look at its full-year results for the bigger picture. How did its fiscal 2018 results fare?
OpenText’s fiscal 2018 results
Here are some key metrics compared to the same period in 2017:
Fiscal 2017 | Fiscal 2018 | Change | |
Total revenues | US$2,291.1 million | US$2,815.2 million | 22.9% |
Annual recurring revenues | US$1,686.6 million | US$2,061.5 million | 22.2% |
Diluted earnings per share | US$2.02 | US$2.56 | 26.7% |
Adjusted EBITDA | US$792.5 million | US$1,019.1 million | 28.6% |
Operating cash flows | US$439.3 million | US$709.9 million | 61.6% |
In fiscal 2018, OpenText reached record total revenues and annual recurring revenue of about US$2.8 billion and US$2 billion, respectively.
Its recurring revenue consists of cloud services, subscriptions revenue, and customer support revenue. It is a high-quality form of revenue because of its recurring nature. Another positive note is that OpenText expanded its adjusted EBITDA margin from 34.6% to 36.2%.

Is OpenText a buy, hold, or sell today?
Management aims to expand the adjusted EBITDA margin to 38-40% by fiscal 2021 through a number of efforts, including but not limited to improving efficiency across the company via the use of artificial intelligence and automation and improving cloud margin via optimization, offshore, and platform consolidation.
OpenText will continue to grow through margin expansion, acquisitions, and organic growth as it has in the past. However, the stock isn’t cheap based on its long-term normal multiple.
Moreover, it’s not uncommon for the stock to experience volatility when it comes earnings report time. So, interested investors should look to buy the stock when it experiences meaningful dips.
The stock may be a hold for participation in the long-term growth runway of global enterprise information management, which is the space that OpenText is in.
More reading
4 Great Investments That Will Provide You With Monthly Income
Free investor brief: Our 3 top SELL recommendations for 2018
Retirees: How You Can Earn $700 a Month in Dividends With Less Than $100k in Savings
Fool contributor Kay Ng owns shares of Open Text. The Motley Fool owns shares of Open Text. OpenText is a recommendation of Stock Advisor Canada.
