
 Yahoo Finance
 OneMain Holdings' (NYSE:OMF) five-year earnings growth trails the 20% YoY shareholder returns
The simplest way to invest in stocks is to buy exchange traded funds. But in our experience, buying the right stocks can give your wealth a significant boost. For example, the OneMain Holdings, Inc. (NYSE:OMF) share price is 48% higher than it was five years ago, which is more than the market average. Zooming in, the stock is actually down 23% in the last year.
The past week has proven to be lucrative for OneMain Holdings investors, so let's see if fundamentals drove the company's five-year performance.
See our latest analysis for OneMain Holdings
While the efficient markets hypothesis continues to be taught by some, it has been proven that markets are over-reactive dynamic systems, and investors are not always rational. One flawed but reasonable way to assess how sentiment around a company has changed is to compare the earnings per share (EPS) with the share price.
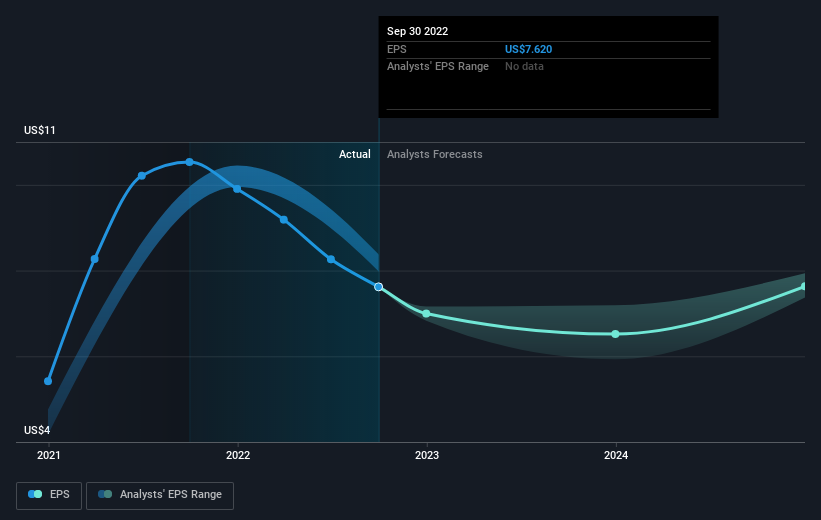
Over half a decade, OneMain Holdings managed to grow its earnings per share at 44% a year. This EPS growth is higher than the 8% average annual increase in the share price. So one could conclude that the broader market has become more cautious towards the stock. The reasonably low P/E ratio of 4.91 also suggests market apprehension.
You can see how EPS has changed over time in the image below (click on the chart to see the exact values).
We consider it positive that insiders have made significant purchases in the last year. Even so, future earnings will be far more important to whether current shareholders make money. It might be well worthwhile taking a look at our free report on OneMain Holdings' earnings, revenue and cash flow.
What About Dividends?
As well as measuring the share price return, investors should also consider the total shareholder return (TSR). The TSR is a return calculation that accounts for the value of cash dividends (assuming that any dividend received was reinvested) and the calculated value of any discounted capital raisings and spin-offs. It's fair to say that the TSR gives a more complete picture for stocks that pay a dividend. We note that for OneMain Holdings the TSR over the last 5 years was 146%, which is better than the share price return mentioned above. This is largely a result of its dividend payments!
A Different Perspective
OneMain Holdings shareholders are down 16% over twelve months (even including dividends), which isn't far from the market return of -17%. The silver lining is that longer term investors would have made a total return of 20% per year over half a decade. If the stock price has been impacted by changing sentiment, rather than deteriorating business conditions, it could spell opportunity. While it is well worth considering the different impacts that market conditions can have on the share price, there are other factors that are even more important. Even so, be aware that OneMain Holdings is showing 3 warning signs in our investment analysis , and 2 of those shouldn't be ignored...
There are plenty of other companies that have insiders buying up shares. You probably do not want to miss this free list of growing companies that insiders are buying.
Please note, the market returns quoted in this article reflect the market weighted average returns of stocks that currently trade on US exchanges.
Have feedback on this article? Concerned about the content? Get in touch with us directly. Alternatively, email editorial-team (at) simplywallst.com.
This article by Simply Wall St is general in nature. We provide commentary based on historical data and analyst forecasts only using an unbiased methodology and our articles are not intended to be financial advice. It does not constitute a recommendation to buy or sell any stock, and does not take account of your objectives, or your financial situation. We aim to bring you long-term focused analysis driven by fundamental data. Note that our analysis may not factor in the latest price-sensitive company announcements or qualitative material. Simply Wall St has no position in any stocks mentioned.
Join A Paid User Research Session
You’ll receive a US$30 Amazon Gift card for 1 hour of your time while helping us build better investing tools for the individual investors like yourself. Sign up here
