
 Yahoo Finance
 The one-year underlying earnings growth at Five Below (NASDAQ:FIVE) is promising, but the shareholders are still in the red over that time
The simplest way to benefit from a rising market is to buy an index fund. Active investors aim to buy stocks that vastly outperform the market - but in the process, they risk under-performance. Unfortunately the Five Below, Inc. (NASDAQ:FIVE) share price slid 25% over twelve months. That contrasts poorly with the market return of 28%. However, the longer term returns haven't been so bad, with the stock down 17% in the last three years. More recently, the share price has dropped a further 21% in a month. Importantly, this could be a market reaction to the recently released financial results. You can check out the latest numbers in our company report.
Given the past week has been tough on shareholders, let's investigate the fundamentals and see what we can learn.
See our latest analysis for Five Below
To paraphrase Benjamin Graham: Over the short term the market is a voting machine, but over the long term it's a weighing machine. By comparing earnings per share (EPS) and share price changes over time, we can get a feel for how investor attitudes to a company have morphed over time.
Even though the Five Below share price is down over the year, its EPS actually improved. Of course, the situation might betray previous over-optimism about growth.
It's surprising to see the share price fall so much, despite the improved EPS. But we might find some different metrics explain the share price movements better.
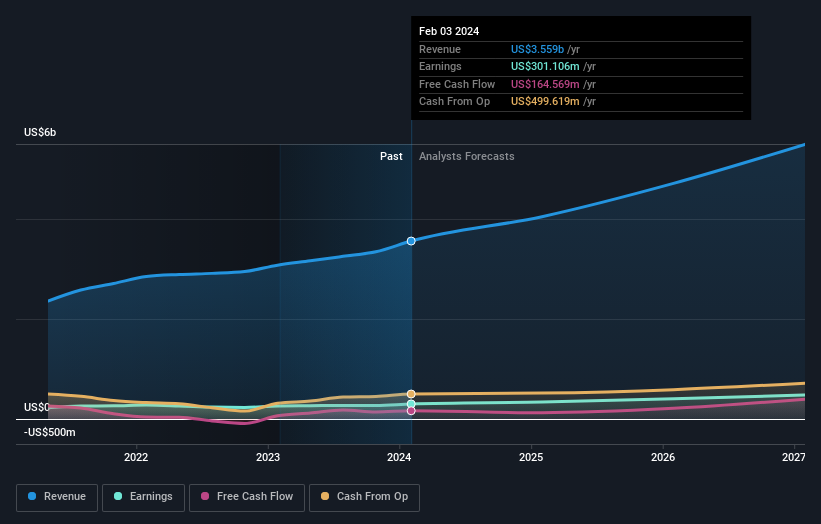
Five Below managed to grow revenue over the last year, which is usually a real positive. Since we can't easily explain the share price movement based on these metrics, it might be worth considering how market sentiment has changed towards the stock.
You can see below how earnings and revenue have changed over time (discover the exact values by clicking on the image).
Five Below is well known by investors, and plenty of clever analysts have tried to predict the future profit levels. If you are thinking of buying or selling Five Below stock, you should check out this free report showing analyst consensus estimates for future profits.
A Different Perspective
Investors in Five Below had a tough year, with a total loss of 25%, against a market gain of about 28%. However, keep in mind that even the best stocks will sometimes underperform the market over a twelve month period. Longer term investors wouldn't be so upset, since they would have made 4%, each year, over five years. If the fundamental data continues to indicate long term sustainable growth, the current sell-off could be an opportunity worth considering. It's always interesting to track share price performance over the longer term. But to understand Five Below better, we need to consider many other factors. Consider risks, for instance. Every company has them, and we've spotted 1 warning sign for Five Below you should know about.
If you are like me, then you will not want to miss this free list of growing companies that insiders are buying.
Please note, the market returns quoted in this article reflect the market weighted average returns of stocks that currently trade on American exchanges.
Have feedback on this article? Concerned about the content? Get in touch with us directly. Alternatively, email editorial-team (at) simplywallst.com.
This article by Simply Wall St is general in nature. We provide commentary based on historical data and analyst forecasts only using an unbiased methodology and our articles are not intended to be financial advice. It does not constitute a recommendation to buy or sell any stock, and does not take account of your objectives, or your financial situation. We aim to bring you long-term focused analysis driven by fundamental data. Note that our analysis may not factor in the latest price-sensitive company announcements or qualitative material. Simply Wall St has no position in any stocks mentioned.
