
 Yahoo Finance
 One Thing To Remember About The Stellar AfricaGold Inc. (CVE:SPX) Share Price

If you're interested in Stellar AfricaGold Inc. (CVE:SPX), then you might want to consider its beta (a measure of share price volatility) in order to understand how the stock could impact your portfolio. Volatility is considered to be a measure of risk in modern finance theory. Investors may think of volatility as falling into two main categories. The first type is company specific volatility. Investors use diversification across uncorrelated stocks to reduce this kind of price volatility across the portfolio. The second type is the broader market volatility, which you cannot diversify away, since it arises from macroeconomic factors which directly affects all the stocks on the market.
Some stocks mimic the volatility of the market quite closely, while others demonstrate muted, exagerrated or uncorrelated price movements. Some investors use beta as a measure of how much a certain stock is impacted by market risk (volatility). While we should keep in mind that Warren Buffett has cautioned that 'Volatility is far from synonymous with risk', beta is still a useful factor to consider. To make good use of it you must first know that the beta of the overall market is one. A stock with a beta greater than one is more sensitive to broader market movements than a stock with a beta of less than one.
View our latest analysis for Stellar AfricaGold
What we can learn from SPX's beta value
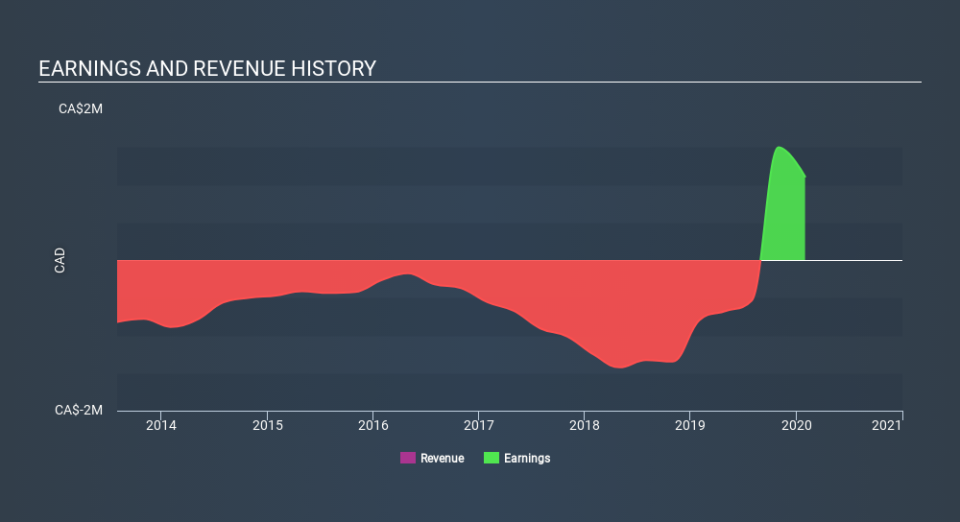
Zooming in on Stellar AfricaGold, we see it has a five year beta of 1.83. This is above 1, so historically its share price has been influenced by the broader volatility of the stock market. If this beta value holds true in the future, Stellar AfricaGold shares are likely to rise more than the market when the market is going up, but fall faster when the market is going down. Share price volatility is well worth considering, but most long term investors consider the history of revenue and earnings growth to be more important. Take a look at how Stellar AfricaGold fares in that regard, below.
Could SPX's size cause it to be more volatile?
Stellar AfricaGold is a noticeably small company, with a market capitalisation of CA$2.0m. Most companies this size are not always actively traded. It has a relatively high beta, suggesting it is fairly actively traded for a company of its size. Because it takes less capital to move the share price of a small company like this, when a stock this size is actively traded it is quite often more sensitive to market volatility than similar large companies.
What this means for you:
Since Stellar AfricaGold tends to move up when the market is going up, and down when it's going down, potential investors may wish to reflect on the overall market, when considering the stock. This article aims to educate investors about beta values, but it's well worth looking at important company-specific fundamentals such as Stellar AfricaGold’s financial health and performance track record. I urge you to continue your research by taking a look at the following:
Financial Health: Are SPX’s operations financially sustainable? Balance sheets can be hard to analyze, which is why we’ve done it for you. Check out our financial health checks here.
Past Track Record: Has SPX been consistently performing well irrespective of the ups and downs in the market? Go into more detail in the past performance analysis and take a look at the free visual representations of SPX's historicals for more clarity.
Other High-Performing Stocks: Are there other stocks that provide better prospects with proven track records? Explore our free list of these great stocks here.
Love or hate this article? Concerned about the content? Get in touch with us directly. Alternatively, email editorial-team@simplywallst.com.
This article by Simply Wall St is general in nature. It does not constitute a recommendation to buy or sell any stock, and does not take account of your objectives, or your financial situation. We aim to bring you long-term focused analysis driven by fundamental data. Note that our analysis may not factor in the latest price-sensitive company announcements or qualitative material. Simply Wall St has no position in any stocks mentioned. Thank you for reading.