
 Yahoo Finance
 One Thing To Remember About The Redline Communications Group Inc. (TSE:RDL) Share Price

Want to participate in a short research study? Help shape the future of investing tools and you could win a $250 gift card!
If you’re interested in Redline Communications Group Inc. (TSE:RDL), then you might want to consider its beta (a measure of share price volatility) in order to understand how the stock could impact your portfolio. Volatility is considered to be a measure of risk in modern finance theory. Investors may think of volatility as falling into two main categories. The first category is company specific volatility. This can be dealt with by limiting your exposure to any particular stock. The second sort is caused by the natural volatility of markets, overall. For example, certain macroeconomic events will impact (virtually) all stocks on the market.
Some stocks see their prices move in concert with the market. Others tend towards stronger, gentler or unrelated price movements. Some investors use beta as a measure of how much a certain stock is impacted by market risk (volatility). While we should keep in mind that Warren Buffett has cautioned that ‘Volatility is far from synonymous with risk’, beta is still a useful factor to consider. To make good use of it you must first know that the beta of the overall market is one. A stock with a beta below one is either less volatile than the market, or more volatile but not corellated with the overall market. In comparison a stock with a beta of over one tends to be move in a similar direction to the market in the long term, but with greater changes in price.
View our latest analysis for Redline Communications Group
What we can learn from RDL’s beta value
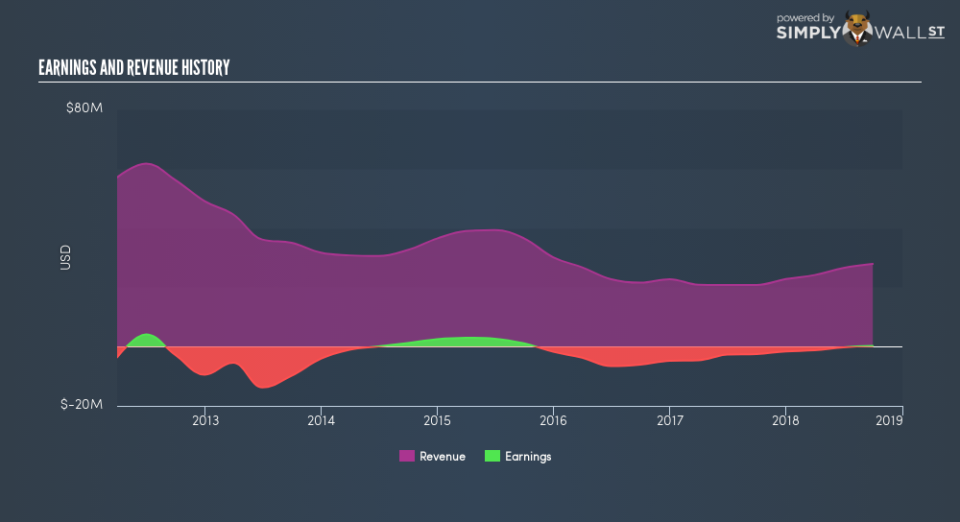
Given that it has a beta of 1.17, we can surmise that the Redline Communications Group share price has been fairly sensitive to market volatility (over the last 5 years). Based on this history, investors should be aware that Redline Communications Group are likely to rise strongly in times of greed, but sell off in times of fear. Many would argue that beta is useful in position sizing, but fundamental metrics such as revenue and earnings are more important overall. You can see Redline Communications Group’s revenue and earnings in the image below.
Does RDL’s size influence the expected beta?
With a market capitalisation of CA$21m, Redline Communications Group is a very small company by global standards. It is quite likely to be unknown to most investors. It takes less money to influence the share price of a very small company. This may explain the excess volatility implied by this beta value.
What this means for you:
Since Redline Communications Group has a reasonably high beta, it’s worth considering why it is so heavily influenced by broader market sentiment. For example, it might be a high growth stock or have a lot of operating leverage in its business model. In order to fully understand whether RDL is a good investment for you, we also need to consider important company-specific fundamentals such as Redline Communications Group’s financial health and performance track record. I urge you to continue your research by taking a look at the following:
Future Outlook: What are well-informed industry analysts predicting for RDL’s future growth? Take a look at our free research report of analyst consensus for RDL’s outlook.
Past Track Record: Has RDL been consistently performing well irrespective of the ups and downs in the market? Go into more detail in the past performance analysis and take a look at the free visual representations of RDL’s historicals for more clarity.
Other Interesting Stocks: It’s worth checking to see how RDL measures up against other companies on valuation. You could start with this free list of prospective options.
To help readers see past the short term volatility of the financial market, we aim to bring you a long-term focused research analysis purely driven by fundamental data. Note that our analysis does not factor in the latest price-sensitive company announcements.
The author is an independent contributor and at the time of publication had no position in the stocks mentioned. For errors that warrant correction please contact the editor at editorial-team@simplywallst.com.