
 Yahoo Finance
 What Is Omnicom Group's (NYSE:OMC) P/E Ratio After Its Share Price Tanked?

To the annoyance of some shareholders, Omnicom Group (NYSE:OMC) shares are down a considerable 33% in the last month. That drop has capped off a tough year for shareholders, with the share price down 30% in that time.
Assuming nothing else has changed, a lower share price makes a stock more attractive to potential buyers. While the market sentiment towards a stock is very changeable, in the long run, the share price will tend to move in the same direction as earnings per share. So, on certain occasions, long term focussed investors try to take advantage of pessimistic expectations to buy shares at a better price. One way to gauge market expectations of a stock is to look at its Price to Earnings Ratio (PE Ratio). A high P/E implies that investors have high expectations of what a company can achieve compared to a company with a low P/E ratio.
Check out our latest analysis for Omnicom Group
Does Omnicom Group Have A Relatively High Or Low P/E For Its Industry?
Omnicom Group's P/E is 8.58. You can see in the image below that the average P/E (9.1) for companies in the media industry is roughly the same as Omnicom Group's P/E.
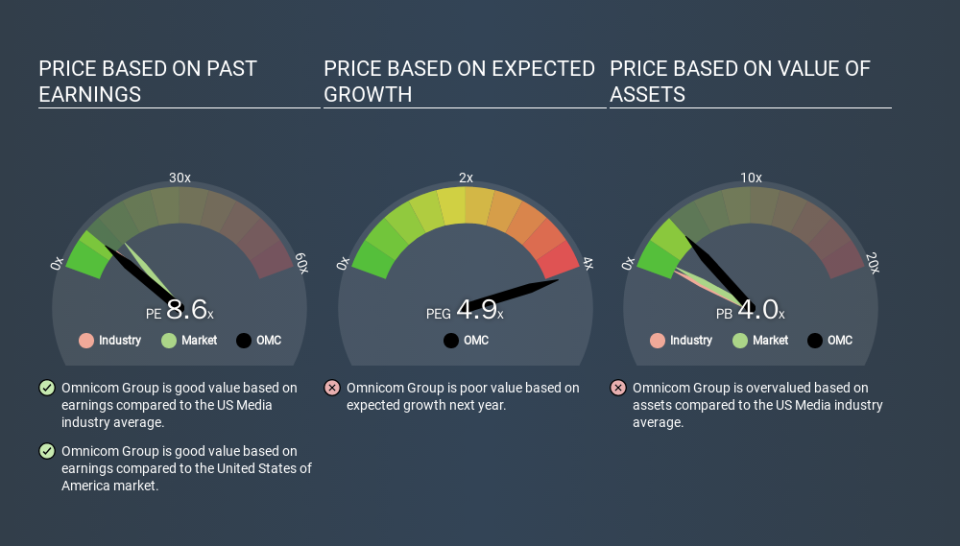
Its P/E ratio suggests that Omnicom Group shareholders think that in the future it will perform about the same as other companies in its industry classification. The company could surprise by performing better than average, in the future. I would further inform my view by checking insider buying and selling., among other things.
How Growth Rates Impact P/E Ratios
Probably the most important factor in determining what P/E a company trades on is the earnings growth. If earnings are growing quickly, then the 'E' in the equation will increase faster than it would otherwise. That means unless the share price increases, the P/E will reduce in a few years. And as that P/E ratio drops, the company will look cheap, unless its share price increases.
Omnicom Group's earnings per share grew by 4.1% in the last twelve months. And its annual EPS growth rate over 5 years is 7.4%.
A Limitation: P/E Ratios Ignore Debt and Cash In The Bank
Don't forget that the P/E ratio considers market capitalization. In other words, it does not consider any debt or cash that the company may have on the balance sheet. Hypothetically, a company could reduce its future P/E ratio by spending its cash (or taking on debt) to achieve higher earnings.
Spending on growth might be good or bad a few years later, but the point is that the P/E ratio does not account for the option (or lack thereof).
How Does Omnicom Group's Debt Impact Its P/E Ratio?
Omnicom Group has net debt worth just 7.4% of its market capitalization. So it doesn't have as many options as it would with net cash, but its debt would not have much of an impact on its P/E ratio.
The Bottom Line On Omnicom Group's P/E Ratio
Omnicom Group's P/E is 8.6 which is below average (11.8) in the US market. EPS grew over the last twelve months, and debt levels are quite reasonable. The P/E ratio implies the market is cautious about longer term prospects. What can be absolutely certain is that the market has become more pessimistic about Omnicom Group over the last month, with the P/E ratio falling from 12.9 back then to 8.6 today. For those who prefer invest in growth, this stock apparently offers limited promise, but the deep value investors may find the pessimism around this stock enticing.
When the market is wrong about a stock, it gives savvy investors an opportunity. If it is underestimating a company, investors can make money by buying and holding the shares until the market corrects itself. So this free visualization of the analyst consensus on future earnings could help you make the right decision about whether to buy, sell, or hold.
Of course, you might find a fantastic investment by looking at a few good candidates. So take a peek at this free list of companies with modest (or no) debt, trading on a P/E below 20.
If you spot an error that warrants correction, please contact the editor at editorial-team@simplywallst.com. This article by Simply Wall St is general in nature. It does not constitute a recommendation to buy or sell any stock, and does not take account of your objectives, or your financial situation. Simply Wall St has no position in the stocks mentioned.
We aim to bring you long-term focused research analysis driven by fundamental data. Note that our analysis may not factor in the latest price-sensitive company announcements or qualitative material. Thank you for reading.
