
 Yahoo Finance
 Omega Flex (NASDAQ:OFLX) shareholders have earned a 34% CAGR over the last five years
The most you can lose on any stock (assuming you don't use leverage) is 100% of your money. But when you pick a company that is really flourishing, you can make more than 100%. One great example is Omega Flex, Inc. (NASDAQ:OFLX) which saw its share price drive 286% higher over five years.
Now it's worth having a look at the company's fundamentals too, because that will help us determine if the long term shareholder return has matched the performance of the underlying business.
View our latest analysis for Omega Flex
To quote Buffett, 'Ships will sail around the world but the Flat Earth Society will flourish. There will continue to be wide discrepancies between price and value in the marketplace...' One flawed but reasonable way to assess how sentiment around a company has changed is to compare the earnings per share (EPS) with the share price.
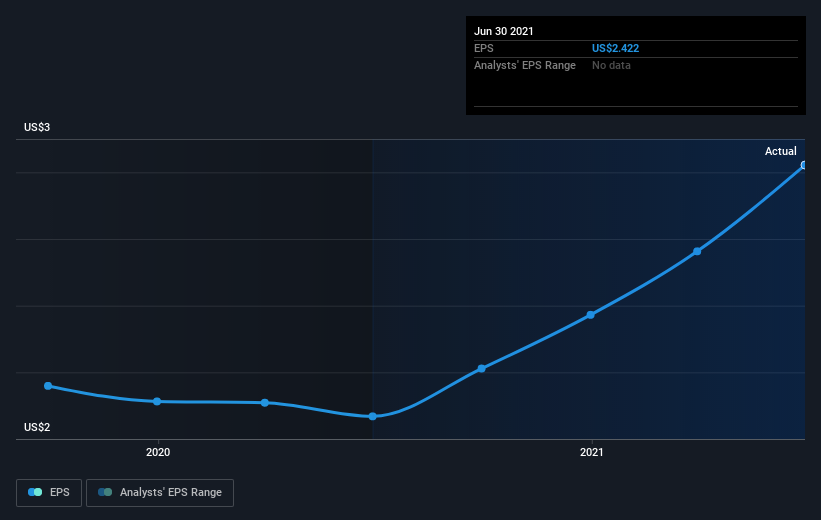
During five years of share price growth, Omega Flex achieved compound earnings per share (EPS) growth of 9.8% per year. This EPS growth is slower than the share price growth of 31% per year, over the same period. This suggests that market participants hold the company in higher regard, these days. That's not necessarily surprising considering the five-year track record of earnings growth. This optimism is visible in its fairly high P/E ratio of 60.69.
You can see how EPS has changed over time in the image below (click on the chart to see the exact values).
It might be well worthwhile taking a look at our free report on Omega Flex's earnings, revenue and cash flow.
What About Dividends?
As well as measuring the share price return, investors should also consider the total shareholder return (TSR). The TSR incorporates the value of any spin-offs or discounted capital raisings, along with any dividends, based on the assumption that the dividends are reinvested. So for companies that pay a generous dividend, the TSR is often a lot higher than the share price return. As it happens, Omega Flex's TSR for the last 5 years was 324%, which exceeds the share price return mentioned earlier. This is largely a result of its dividend payments!
A Different Perspective
Omega Flex shareholders are up 13% for the year (even including dividends). But that return falls short of the market. If we look back over five years, the returns are even better, coming in at 34% per year for five years. It may well be that this is a business worth popping on the watching, given the continuing positive reception, over time, from the market. Most investors take the time to check the data on insider transactions. You can click here to see if insiders have been buying or selling.
We will like Omega Flex better if we see some big insider buys. While we wait, check out this free list of growing companies with considerable, recent, insider buying.
Please note, the market returns quoted in this article reflect the market weighted average returns of stocks that currently trade on US exchanges.
This article by Simply Wall St is general in nature. We provide commentary based on historical data and analyst forecasts only using an unbiased methodology and our articles are not intended to be financial advice. It does not constitute a recommendation to buy or sell any stock, and does not take account of your objectives, or your financial situation. We aim to bring you long-term focused analysis driven by fundamental data. Note that our analysis may not factor in the latest price-sensitive company announcements or qualitative material. Simply Wall St has no position in any stocks mentioned.
Have feedback on this article? Concerned about the content? Get in touch with us directly. Alternatively, email editorial-team (at) simplywallst.com.
