
 Yahoo Finance
 Ocular Therapeutix Stock Gives Every Indication Of Being Possible Value Trap
- By GF Value
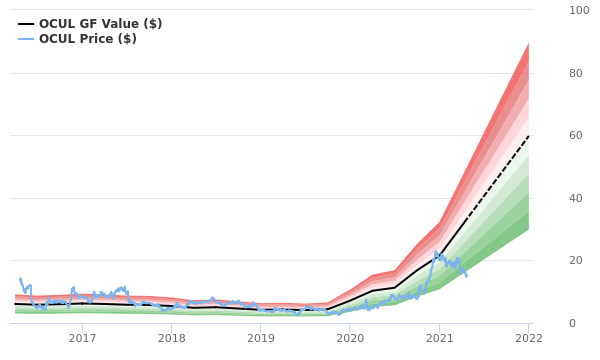
The stock of Ocular Therapeutix (NAS:OCUL, 30-year Financials) is estimated to be possible value trap, according to GuruFocus Value calculation. GuruFocus Value is GuruFocus' estimate of the fair value at which the stock should be traded. It is calculated based on the historical multiples that the stock has traded at, the past business growth and analyst estimates of future business performance. If the price of a stock is significantly above the GF Value Line, it is overvalued and its future return is likely to be poor. On the other hand, if it is significantly below the GF Value Line, its future return will likely be higher. At its current price of $15.29 per share and the market cap of $1.2 billion, Ocular Therapeutix stock shows every sign of being possible value trap. GF Value for Ocular Therapeutix is shown in the chart below.
The reason we think that Ocular Therapeutix stock might be a value trap is because Ocular Therapeutix has an Altman Z-score of -0.06, which indicates that the financial condition of the company is in the distressed zone and implies a higher risk of bankruptcy. An Altman Z-score of above 2.99 would be better, indicating safe financial conditions. To learn more about how the Z-score measures the financial risk of the company, please go here.
Link: These companies may deliever higher future returns at reduced risk.
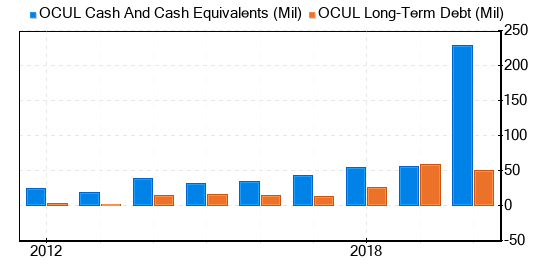
It is always important to check the financial strength of a company before buying its stock. Investing in companies with poor financial strength have a higher risk of permanent loss. Looking at the cash-to-debt ratio and interest coverage is a great way to understand the financial strength of a company. Ocular Therapeutix has a cash-to-debt ratio of 3.90, which is in the middle range of the companies in Biotechnology industry. The overall financial strength of Ocular Therapeutix is 3 out of 10, which indicates that the financial strength of Ocular Therapeutix is poor. This is the debt and cash of Ocular Therapeutix over the past years:
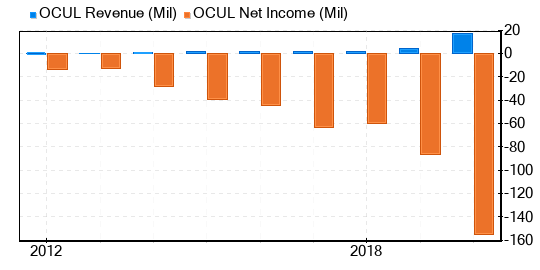
Investing in profitable companies carries less risk, especially in companies that have demonstrated consistent profitability over the long term. Typically, a company with high profit margins offers better performance potential than a company with low profit margins. Ocular Therapeutix has been profitable 0 years over the past 10 years. During the past 12 months, the company had revenues of $17.4 million and loss of $2.47 a share. Its operating margin of -361.13% in the middle range of the companies in Biotechnology industry. Overall, GuruFocus ranks Ocular Therapeutix's profitability as poor. This is the revenue and net income of Ocular Therapeutix over the past years:
One of the most important factors in the valuation of a company is growth. Long-term stock performance is closely correlated with growth according to GuruFocus research. Companies that grow faster create more value for shareholders, especially if that growth is profitable. The average annual revenue growth of Ocular Therapeutix is 62.2%, which ranks better than 88% of the companies in Biotechnology industry. The 3-year average EBITDA growth is -5%, which ranks worse than 66% of the companies in Biotechnology industry.
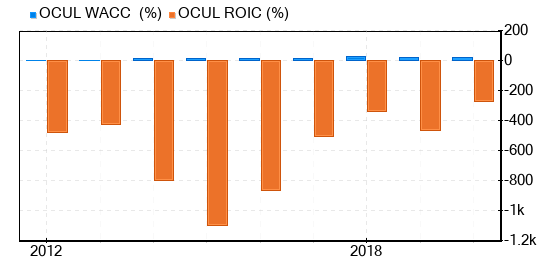
Another way to look at the profitability of a company is to compare its return on invested capital and the weighted cost of capital. Return on invested capital (ROIC) measures how well a company generates cash flow relative to the capital it has invested in its business. The weighted average cost of capital (WACC) is the rate that a company is expected to pay on average to all its security holders to finance its assets. We want to have the return on invested capital higher than the weighted cost of capital. For the past 12 months, Ocular Therapeutix's return on invested capital is -280.13, and its cost of capital is 14.45. The historical ROIC vs WACC comparison of Ocular Therapeutix is shown below:
In summary, The stock of Ocular Therapeutix (NAS:OCUL, 30-year Financials) is estimated to be possible value trap. The company's financial condition is poor and its profitability is poor. Its growth ranks worse than 66% of the companies in Biotechnology industry. To learn more about Ocular Therapeutix stock, you can check out its 30-year Financials here.
To find out the high quality companies that may deliever above average returns, please check out GuruFocus High Quality Low Capex Screener.
This article first appeared on GuruFocus.
