
 Yahoo Finance
 Oceaneering's (OII) Q4 Earnings & Revenues Miss Estimates
Oceaneering International, Inc. OII, a global supplier of engineering services and products, reported fourth-quarter 2022 adjusted profit of 6 cents per share, missing the Zacks Consensus Estimate of a profit of 17 cents. This underperformance was due to weaker results in certain segments.
However, the bottom line was better than the year-ago quarter’s profit of 5 cents.This can be attributed to higher year-over-year revenues from the Subsea Robotics and the Offshore Projects Group segments.
Oceaneering’s net quarterly revenues of $536.2 million missed the Zacks Consensus Estimate of $537 million. However, the top line increased approximately 14.9% from the year-ago quarter’s figure of $466.8 million.
Oceaneering International, Inc. Price, Consensus and EPS Surprise
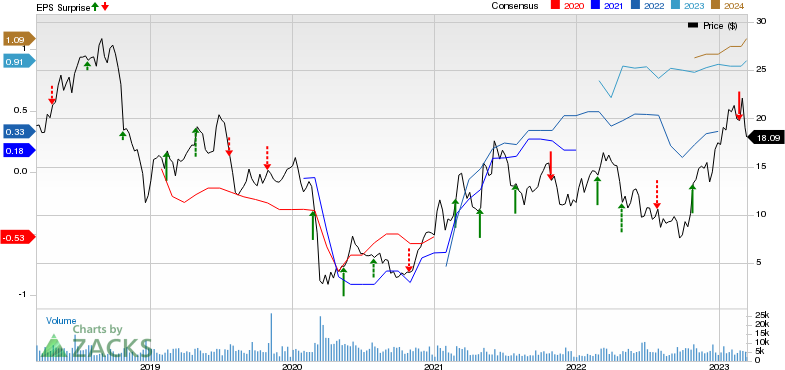
Oceaneering International, Inc. price-consensus-eps-surprise-chart | Oceaneering International, Inc. Quote
Segmental Information
Subsea Robotics: The unit provides remotely operated submersible vehicles for drill support, vessel-based inspection, subsea hardware installation, pipeline surveys and maintenance services.
Revenues of this segment were $167.4 million compared with the year-ago quarter’s $134.3 million. Operating income was $43.7 million compared with the year-ago quarter’s $21 million. Days on hire rose 12.5% year over year to 14,350, while ROV utilization increased to 62%.
Manufactured Products: The segment focuses on the manufactured products business, theme park entertainment systems and automated guided vehicles.
Revenues were $100.2 million compared with the prior-year quarter’s $102.9 million. The segment posted an operating profit of about $6.1 million in the fourth quarter, turning around from the year-ago quarter’s loss of $20.2 million. This improvement was due to a highly favorable project mix. The backlog rose to $467 million as of Dec 31, 2022.
Offshore Projects Group: This includes Oceaneering’s former Subsea Projects segment, excluding survey services and global data solutions, and the service and rental business, without ROV tooling.
Revenues increased about 43.4% to $122.5 million from $85.4 million in the year-ago quarter. Operating income was $10.8 million compared with $6.8 million in the fourth quarter of 2021.
Integrity Management & Digital Solutions: This segment mainly covers Oceaneering’s Asset Integrity segment, along with its global data solutions business.
Revenues of $55.4 million went down from the year-ago quarter’s $60.4 million. Operating income was $4.9 million compared with the prior-year quarter’s $6 million. This was a result of operational issues.
Aerospace and Defense Technologies: The segment is engaged in Oceaneering’s government business, which focuses on defense subsea technologies, marine services and space systems.
Revenues were $90.8 million compared with $83.7 million in the fourth quarter of 2021. Operating income was $10.3 million compared with $10.5 million in the year-ago quarter. This marginal decline was due to changes in the project mix.
Capital Expenditure & Balance Sheet
As of Dec 31, 2022, capital expenditure including acquisitions, were $26 million. OII had cash worth $568.8 million, along with a long-term debt of about $701 million. The debt-to-total capital was 57.1%.
Outlook
Oceaneering anticipates an increase in revenues across several sectors including Subsea Robotics, Manufactured Products, Offshore Projects Group, Integrity Management & Digital Solutions, and Aerospace and Defense Technologies.
In addition to this, the company expects improved operating income and stable margins in Aerospace and Defense Technologies. It also expects stable operating income and margins in Integrity Management & Digital Solutions.
For the first quarter of 2023, Oceaneering predicts unallocated expenses in the mid-to-high $30 million range.
For 2023, Oceaneering projects consolidated EBITDA in the $260 million-$310 million range and free cash flow generation in the $75-$125 million range.
Capital Expenditures are expected in the $90-$110 million range.
Zacks Rank and Key Picks
Currently, Oceaneering International carries a Zacks Rank #3 (Hold). Investors interested in the energy sector might look at some better-ranked stocks like NGL Energy Partners (NGL), sporting a Zacks Rank #1 (Strong Buy), and Energy Transfer ET and Helix Energy Solutions Group HLX, each holding a Zacks Rank #2 (Buy). You can see the complete list of today’s Zacks #1 Rank stocks here.
NGL Energy Partners: The company is worth approximately $451.75 million. Its shares have increased 48.8% in the past year.
NGL Energy Partners is a limited partnership company that operates a vertically-integrated propane business with three segments — retail propane, wholesale supply and marketing, and midstream.
Energy Transfer LP: The company is valued at around $38.99 billion. It delivered an average earnings surprise of 11.43% for the last four quarters and its current dividend yield is 9.48%.
ET currently has a forward P/E ratio of 9.17. In comparison, its industry has an average forward P/E of 9.40, which means the company is trading at a discount to the group.
Helix Energy Solutions Group: The company is valued at around $1.20 billion. In the past year, its stock has increased 63.3%.
HLX currently has a forward P/E ratio of 12.02. In comparison, its industry has an average forward P/E of 12.50, which means the company is trading at a discount to the group.
Want the latest recommendations from Zacks Investment Research? Today, you can download 7 Best Stocks for the Next 30 Days. Click to get this free report
Oceaneering International, Inc. (OII) : Free Stock Analysis Report
NGL Energy Partners LP (NGL) : Free Stock Analysis Report
Energy Transfer LP (ET) : Free Stock Analysis Report
Helix Energy Solutions Group, Inc. (HLX) : Free Stock Analysis Report
