
 Yahoo Finance
 NZD/USD Forex Technical Analysis – Strengthens Over .6982, Weakens Under .6963
The New Zealand Dollar is edging higher late in the session on Thursday in a mostly lackluster trade after three days of heightened volatility. The Kiwi is being supported by a dip in U.S. Treasury yields and firm demand for risky assets, but a turnaround in the U.S. Dollar helped put a lid on the early rally.
At 18:57 GMT, the NZD/USD is trading .6980, up 0.0009 or +0.14%.
In economic news, U.S. Treasury yields moved lower on Thursday after weekly jobless claims data came in higher than expected. Existing home sales rose slightly in June, breaking a four-month slide.
In other news, the European Central Bank (ECB) reaffirmed its dovish stance and left interest rates unchanged in its late policy statement.
The number of Kiwi traders who expect the Reserve Bank to raise interest rates 25 basis points in August stands at 62%. This is down from 90%. This suggests they are worried that the COVID-19 variant may slow down the pace of the economic recovery.
Daily Swing Chart Technical Analysis
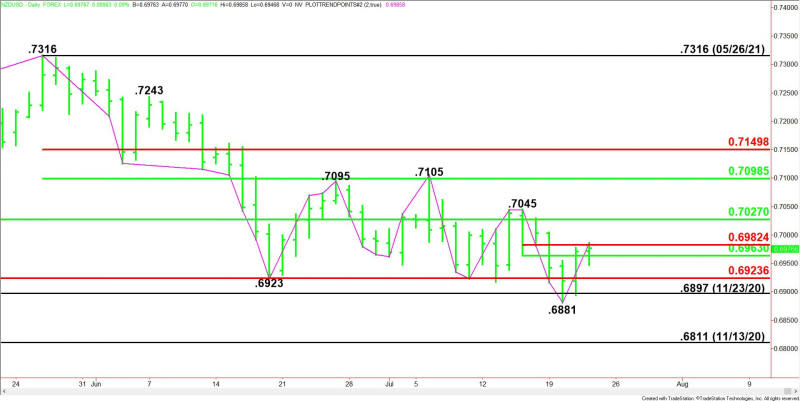
The main trend is down according to the daily swing chart. A trade through .6881 will signal a resumption of the downtrend. The main trend will change to up on a trade through .7045.
The minor range is .7045 to .6881. Its retracement zone at .6963 to .6982 is currently being tested. Trader reaction to this zone could determine the near-term direction of the Kiwi.
On the downside, support is a long-term Fibonacci level at .6924.
On the upside, the resistance is a long-term 50% level at .7027.
Daily Swing Chart Technical Forecast
The direction of the NZD/USD into the close on Thursday is likely to be determined by trader reaction to .6963 to .6982.
Bullish Scenario
A sustained move over .6982 will indicate the presence of buyers. If this move is able to generate enough upside momentum then look for an acceleration into .7027, followed closely by .7045.
Bearish Scenario
A sustained move under .6963 will signal the presence of sellers. If this creates enough downside momentum then look for the selling to possibly extend into the long-term Fibonacci level at .6924, followed by the new main bottom at .6881.
For a look at all of today’s economic events, check out our economic calendar.
This article was originally posted on FX Empire
More From FXEMPIRE:
AUD/USD Forex Technical Analysis – Retracement Zone at .7397 to .7422 Next Major Hurdle to Overcome
A Busy Economic Calendar Puts the EUR, the Pound, the Loonie, and the Dollar in Focus
USD/CAD Daily Forecast – U.S. Dollar Rebounds After Recent Pullback
Natural Gas Price Forecast – Natural Gas Markets Continue to Look Elevated
NZD/USD Forex Technical Analysis – Strengthens Over .6982, Weakens Under .6963
Twitter’s Shares Rally Following Fastest Revenue Growth In Seven Years
