
 Yahoo Finance
 NZD/USD Forex Technical Analysis – Trader Reaction to .6632 Sets the Tone
The New Zealand Dollar is trading lower early Tuesday after weaker than expected business confidence data and after building consent figures also came in on the weak side.
The Quarterly Survey of Business Opinion showed businesses remain deeply pessimistic, even though they’re not as glum as they were last year. A net 26 percent of those surveyed now expect the economy to worsen this year, although that was down from 35 percent three months ago.
A net 11 percent of respondents expect their own businesses had experienced weaker activity, unchanged from three months earlier.
At 05:38 GMT, the NZD/USD is trading .6627, down 0.0003 or -0.05%.
The building consents figures showed an 8.5 percent fall in consents in November but consents for the 13 months ended November were up 13 percent and at their highest level since 1975.
Daily Swing Chart Technical Analysis
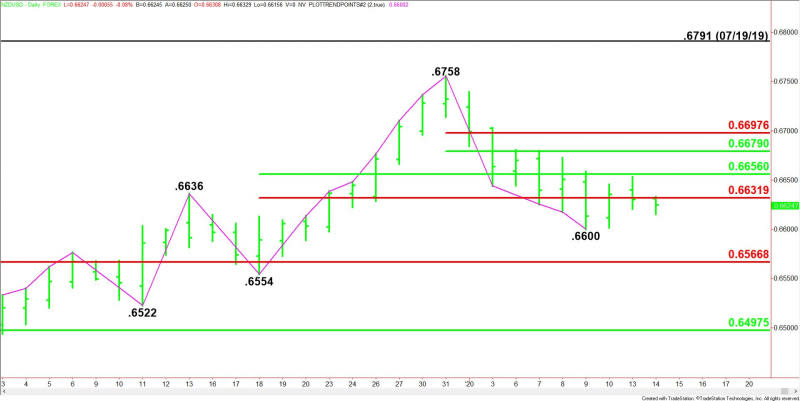
The main trend is up according to the daily swing chart, however, momentum is trending to the downside. A trade through .6554 will change the main trend to down. A move through .6758 will signal a resumption of the uptrend.
The major support is a retracement zone at .6567 to .6497. This zone is controlling the near-term direction of the NZD/USD.
The intermediate range is .6554 to .6758. Its retracement zone at .6632 to .6656 is providing resistance.
The short-term range is .6758 to .6600. If buyers can overcome the intermediate resistance then look for the rally to possibly extend into the short-term retracement zone at .6679 to .6698.
Daily Swing Chart Technical Forecast
Based on the early price action and the current price at .6627, the direction of the NZD/USD the rest of the session on Tuesday is likely to be determined by trader reaction to the Fibonacci level at .6632.
Bearish Scenario
A sustained move under .6632 will indicate the presence of sellers. If this move creates enough downside momentum then look for the selling to extend into last week’s low at .6600.
A trade through .6600 will indicate the selling is getting stronger. This could trigger a further break into the main Fibonacci level at .6567, followed closely by the main bottom at .6554.
Bullish Scenario
Overcoming .6632 will signal the presence of buyers. The next upside target is the 50% level at .6656. Look for resistance on the initial test. However, it is also a potential trigger point for an acceleration into the short-term 50% level at .6679.
This article was originally posted on FX Empire
