
 Yahoo Finance
 Nutanix's (NTNX) Q1 Earnings and Revenues Beat Estimates
Nutanix NTNX reported non-GAAP first-quarter fiscal 2023 earnings of 3 cents per share, significantly narrower than the Zacks Consensus Estimate of a loss of 12 cents and a year-ago quarter’s loss of 22 cents.
Nutanix reported revenues of $433.6 million, beating the Zacks Consensus Estimate of $413.1 million. The top line climbed 15% from the year-ago quarter’s figure of $378.5 million. NTNX noted that the average contract term length declined to 3.0 years from 3.1 years in the year-ago quarter, primarily due to higher federal businesses that usually have shorter contract term lengths.
During the fiscal first quarter, Nutanix’s Annual Contract Value (ACV) billings jumped 27% to $231.9 million.
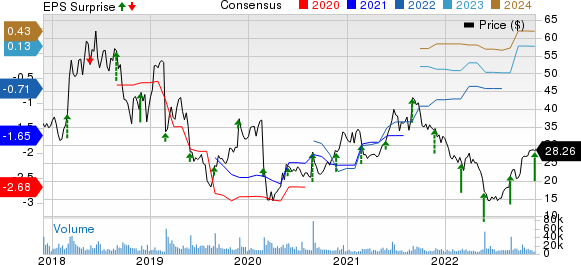
Nutanix Price, Consensus and EPS Surprise
Nutanix price-consensus-eps-surprise-chart | Nutanix Quote
Top-Line Details
Product revenues (48.1% of revenues) increased 15.8% year over year to $208.6 million. Support, entitlements & other services revenues (52 % of revenues) grew 13% to $225 million.
The top line was primarily driven by growth in NTNX’s core hyper-converged infrastructure software and the solid adoption of its new capabilities. Nutanix continues to witness a strong adoption of its hybrid multi-cloud solutions across Fortune 100 and Global 2000 companies.
Subscription revenues (92.9% of revenues) climbed 19% from the year-ago quarter’s figure to $402.9 million. However, professional services revenues (5.1% of revenues) declined 7.5% to $22.3 million.
Non-Portable Software revenues (1.8% of revenues) plunged 45.5% year over year to $7.8 million. Hardware revenues (0.1% of revenues) slumped 71.2% to $624 million.
Billings were up 18% year over year to $469.7 million. Annual Recurring Revenues climbed 34% to $1.28 billion.
During the fiscal first quarter, Nutanix added 530 customers, taking the total number of clients to 23,130.
Operating Details
During the fiscal first quarter, Nutanix’s non-GAAP gross margin expanded 130 basis points (bps) year over year and 80 bps sequentially to 83.4%.
Non-GAAP operating expenses decreased 0.4% year over year to $351.1 million.
Balance Sheet & Cash Flow
As of Oct 31, 2022, cash and cash equivalents plus short-term investments were $1.39 billion, up from $1.32 billion at the end of fourth-quarter fiscal 2022.
During the first quarter of fiscal 2023, cash utilized through operating activities was $65.5 million and free cash flow was $45.8 million.
Outlook
For the second quarter of fiscal 2023, Nutanix expects ACV billings between $245 million and $250 million. Revenues are estimated between $460 million and $470 million.
Non-GAAP gross margin is estimated to be in the 82-83% range. Non-GAAP operating margin is expected in the band of 5-10%.
For the full fiscal 2023, NTNX expects ACV billings between $895 million and $900 million. Revenues are estimated in the range of $1.77-$1.78 billion.
Non-GAAP gross margin is estimated to be 82-83% for fiscal 2023. Non-GAAP operating margin is projected in the range of 2-4%.
Zacks Rank & Key Picks
Nutanix currently carries a Zacks Rank #3 (Hold). Shares of NTNX have declined 11.8% in the past year.
Some top-ranked stocks from the broader Computer and Technology sector are Celestica CLS, Fabrinet FN and Zscaler ZS. While Celestica flaunts a Zacks Rank #1 (Strong Buy), Fabrinet and Zscaler carry a Zacks Rank #2 (Buy). You can see the complete list of today's Zacks #1 Rank stocks here.
The Zacks Consensus Estimate for Celestica’s fourth-quarter 2022 earnings has increased by 9 cents to 53 cents per share over the past 60 days. For 2022, earnings estimates have moved 16 cents up to $1.86 per share in the past 60 days.
CLS' earnings beat the Zacks Consensus Estimate in all the preceding four quarters, the average surprise being 11.8%. Shares of the company have moved up 13.3% in the past year.
The Zacks Consensus Estimate for Fabrinet's second-quarter fiscal 2023 earnings has been revised 16 cents northward to $1.89 per share over the past 30 days. For fiscal 2023, earnings estimates have improved 7.6% to $7.48 per share in the past 30 days.
FN’s earnings beat the Zacks Consensus Estimate in three of the preceding four quarters, missing once, the average surprise being 5.4%. Shares of the company have gained 16.6% in the past year.
The Zacks Consensus Estimate for Zscaler's first-quarter fiscal 2023 earnings has been revised 7 cents north to 26 cents per share over the past 90 days. For fiscal 2023, earnings estimates have moved south by a penny to $1.17 per share in the past 30 days.
ZS' earnings beat the Zacks Consensus Estimate in all the trailing four quarters, the average surprise being 28.6%. Shares of the company have declined 58.1% in the past year.
Want the latest recommendations from Zacks Investment Research? Today, you can download 7 Best Stocks for the Next 30 Days. Click to get this free report
Celestica, Inc. (CLS) : Free Stock Analysis Report
Fabrinet (FN) : Free Stock Analysis Report
Nutanix (NTNX) : Free Stock Analysis Report
Zscaler, Inc. (ZS) : Free Stock Analysis Report
