
 Yahoo Finance
 Nutanix (NTNX) Q3 Earnings and Revenues Surpass Estimates
Nutanix NTNX reported non-GAAP third-quarter fiscal 2023 earnings of 4 cents per share, surpassing the Zacks Consensus Estimate of 2 cents. The company reported an adjusted loss per share of 5 cents in the year-ago quarter.
Nutanix reported revenues of $448.6 million, beating the Zacks Consensus Estimate of $431.6 million. The top line climbed 11% from the year-ago quarter’s figure of $403.7 million. NTNX noted that the average contract term length declined to 3 years from 3.2 years in the year-ago quarter, primarily due to higher federal businesses that usually have shorter contract term lengths.
During the fiscal third quarter, Nutanix’s Annual Contract Value (ACV) billings jumped 17% to $239.8 million.
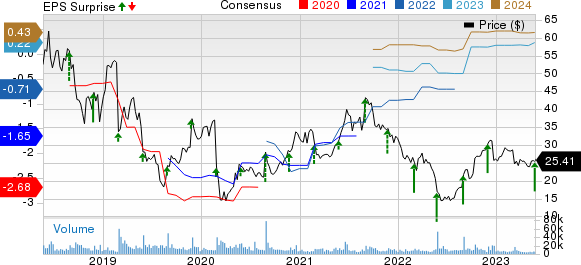
Nutanix Price, Consensus and EPS Surprise
Nutanix price-consensus-eps-surprise-chart | Nutanix Quote
Top-Line Details
Product revenues (47.4% of revenues) increased 6.5% year over year to $212.5 million. Support, entitlements & other services revenues (52.6% of revenues) grew 15.7% to $236.1 million.
The top line was primarily driven by growth in NTNX’s core hyper-converged infrastructure software and the solid adoption of its new capabilities. Nutanix continues to witness a strong adoption of its hybrid multi-cloud solutions across Fortune 100 and Global 2000 companies.
Subscription revenues (93.1% of revenues) climbed 12.7% from the year-ago quarter’s figure to $417.5 million. However, professional services revenues (4.9% of revenues) declined 1.6% to $22.1 million.
Non-Portable Software revenues (1.9% of revenues) increased 1.9% year over year to $8.3 million. Hardware revenues (0.1% of revenues) slumped 53.4% to $619 million.
Billings were up 3.1% year over year to $461.9 million. Annual recurring revenues climbed 32% to $1.47 billion.
During the fiscal third quarter, Nutanix added 430 customers, taking the total number of clients to 24,050.
Operating Details
During the fiscal third quarter, Nutanix’s non-GAAP gross margin expanded 50 basis points year over year to 83.8%.
Non-GAAP operating expenses increased 8% year over year to $369.1 million.
Non-GAAP operating income came in at $7 million against the year-ago quarter’s loss of $5.8 million.
Balance Sheet & Cash Flow
As of Apr 30, 2023, cash and cash equivalents plus short-term investments were $1.36 billion, down from $1.39 billion at the end of first-quarter fiscal 2023.
During the third quarter of fiscal 2023, cash generated through operating activities was $64.3 million and free cash flow was $42.5 million.
Outlook
For the fourth quarter of fiscal 2023, Nutanix expects ACV billings between $240 million and $250 million. Revenues are estimated between $470 million and $480 million.
Non-GAAP gross margin is estimated to be 84%. Non-GAAP operating margin is expected in the band of 9-10%.
For the full fiscal 2023, NTNX expects ACV billings between $915 million and $925 million. Revenues are estimated in the range of $1.84-$1.85 billion.
Non-GAAP gross margin is estimated to be 84% for fiscal 2023. Non-GAAP operating margin is projected in the range of 6-7%.
Zacks Rank & Key Picks
Nutanix carries a Zacks Rank #3 (Hold) at present. Shares of NTNX have gained 18.6% over the past year.
Some top-ranked stocks from the broader Computer and Technology sector are Meta Platforms META, Momo MOMO and ServiceNow NOW, each sporting a Zacks Rank #1 (Strong Buy) at present. You can see the complete list of today's Zacks #1 Rank stocks here.
The Zacks Consensus Estimate for Meta Platforms' second-quarter 2023 earnings has been revised 14% upward to $2.79 per share over the past 30 days. For 2023, earnings estimates have moved north by 12.1% to $11.76 in the past 30 days.
META’s earnings beat the Zacks Consensus Estimate in two of the trailing four quarters, missing twice, the average surprise being 15.5%. Shares of the company have climbed 35.6% in the past year.
The Zacks Consensus Estimate for Momo’s first-quarter 2023 earnings has been revised southward from 36 cents to 32 cents per share over the past 30 days. For 2023, earnings estimates have moved down by 3 cents to $1.55 in the past 30 days.
MOMO's earnings beat the Zacks Consensus Estimate in all the trailing four quarters, the average surprise being 31.9%. Shares of the company have jumped 65.4% in the past year.
The Zacks Consensus Estimate for ServiceNow’s second-quarter 2023 earnings has been revised northward by 11 cents to $2.04 per share over the past 30 days. For 2023, earnings estimates have moved up by 39 cents to $9.54 in the past 30 days.
NOW's earnings beat the Zacks Consensus Estimate in all the trailing four quarters, the average surprise being 10.4%. Shares of the company have inched up 11.1% in the past year.
Want the latest recommendations from Zacks Investment Research? Today, you can download 7 Best Stocks for the Next 30 Days. Click to get this free report
ServiceNow, Inc. (NOW) : Free Stock Analysis Report
Hello Group Inc. Sponsored ADR (MOMO) : Free Stock Analysis Report
Nutanix (NTNX) : Free Stock Analysis Report
Meta Platforms, Inc. (META) : Free Stock Analysis Report
