
 Yahoo Finance
 NowVertical Group Inc.'s (CVE:NOW) Price Is Right But Growth Is Lacking
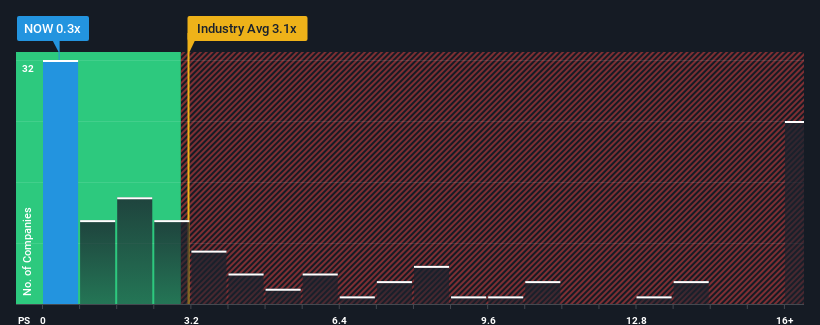
NowVertical Group Inc.'s (CVE:NOW) price-to-sales (or "P/S") ratio of 0.3x might make it look like a strong buy right now compared to the Software industry in Canada, where around half of the companies have P/S ratios above 3.1x and even P/S above 10x are quite common. However, the P/S might be quite low for a reason and it requires further investigation to determine if it's justified.
Check out our latest analysis for NowVertical Group
What Does NowVertical Group's Recent Performance Look Like?
NowVertical Group certainly has been doing a good job lately as it's been growing revenue more than most other companies. Perhaps the market is expecting future revenue performance to dive, which has kept the P/S suppressed. If not, then existing shareholders have reason to be quite optimistic about the future direction of the share price.
Keen to find out how analysts think NowVertical Group's future stacks up against the industry? In that case, our free report is a great place to start.
How Is NowVertical Group's Revenue Growth Trending?
NowVertical Group's P/S ratio would be typical for a company that's expected to deliver very poor growth or even falling revenue, and importantly, perform much worse than the industry.
If we review the last year of revenue growth, the company posted a terrific increase of 173%. This great performance means it was also able to deliver immense revenue growth over the last three years. Therefore, it's fair to say the revenue growth recently has been superb for the company.
Shifting to the future, estimates from the dual analysts covering the company suggest revenue should grow by 14% per year over the next three years. That's shaping up to be materially lower than the 17% per year growth forecast for the broader industry.
With this information, we can see why NowVertical Group is trading at a P/S lower than the industry. Apparently many shareholders weren't comfortable holding on while the company is potentially eyeing a less prosperous future.
The Key Takeaway
Typically, we'd caution against reading too much into price-to-sales ratios when settling on investment decisions, though it can reveal plenty about what other market participants think about the company.
We've established that NowVertical Group maintains its low P/S on the weakness of its forecast growth being lower than the wider industry, as expected. At this stage investors feel the potential for an improvement in revenue isn't great enough to justify a higher P/S ratio. The company will need a change of fortune to justify the P/S rising higher in the future.
And what about other risks? Every company has them, and we've spotted 3 warning signs for NowVertical Group you should know about.
Of course, profitable companies with a history of great earnings growth are generally safer bets. So you may wish to see this free collection of other companies that have reasonable P/E ratios and have grown earnings strongly.
Have feedback on this article? Concerned about the content? Get in touch with us directly. Alternatively, email editorial-team (at) simplywallst.com.
This article by Simply Wall St is general in nature. We provide commentary based on historical data and analyst forecasts only using an unbiased methodology and our articles are not intended to be financial advice. It does not constitute a recommendation to buy or sell any stock, and does not take account of your objectives, or your financial situation. We aim to bring you long-term focused analysis driven by fundamental data. Note that our analysis may not factor in the latest price-sensitive company announcements or qualitative material. Simply Wall St has no position in any stocks mentioned.
