
 Yahoo Finance
 Novem Group (ETR:NVM) Could Be At Risk Of Shrinking As A Company
If you're looking at a mature business that's past the growth phase, what are some of the underlying trends that pop up? When we see a declining return on capital employed (ROCE) in conjunction with a declining base of capital employed, that's often how a mature business shows signs of aging. This indicates the company is producing less profit from its investments and its total assets are decreasing. In light of that, from a first glance at Novem Group (ETR:NVM), we've spotted some signs that it could be struggling, so let's investigate.
Understanding Return On Capital Employed (ROCE)
For those that aren't sure what ROCE is, it measures the amount of pre-tax profits a company can generate from the capital employed in its business. To calculate this metric for Novem Group, this is the formula:
Return on Capital Employed = Earnings Before Interest and Tax (EBIT) ÷ (Total Assets - Current Liabilities)
0.17 = €69m ÷ (€594m - €177m) (Based on the trailing twelve months to December 2023).
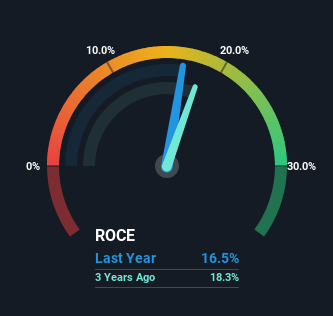
Thus, Novem Group has an ROCE of 17%. In absolute terms, that's a satisfactory return, but compared to the Auto Components industry average of 10% it's much better.
See our latest analysis for Novem Group
In the above chart we have measured Novem Group's prior ROCE against its prior performance, but the future is arguably more important. If you'd like to see what analysts are forecasting going forward, you should check out our free analyst report for Novem Group .
So How Is Novem Group's ROCE Trending?
We are a bit worried about the trend of returns on capital at Novem Group. About four years ago, returns on capital were 27%, however they're now substantially lower than that as we saw above. Meanwhile, capital employed in the business has stayed roughly the flat over the period. This combination can be indicative of a mature business that still has areas to deploy capital, but the returns received aren't as high due potentially to new competition or smaller margins. So because these trends aren't typically conducive to creating a multi-bagger, we wouldn't hold our breath on Novem Group becoming one if things continue as they have.
On a side note, Novem Group has done well to pay down its current liabilities to 30% of total assets. That could partly explain why the ROCE has dropped. What's more, this can reduce some aspects of risk to the business because now the company's suppliers or short-term creditors are funding less of its operations. Some would claim this reduces the business' efficiency at generating ROCE since it is now funding more of the operations with its own money.
What We Can Learn From Novem Group's ROCE
All in all, the lower returns from the same amount of capital employed aren't exactly signs of a compounding machine. Investors haven't taken kindly to these developments, since the stock has declined 37% from where it was year ago. With underlying trends that aren't great in these areas, we'd consider looking elsewhere.
On a final note, we've found 2 warning signs for Novem Group that we think you should be aware of.
While Novem Group isn't earning the highest return, check out this free list of companies that are earning high returns on equity with solid balance sheets.
Have feedback on this article? Concerned about the content? Get in touch with us directly. Alternatively, email editorial-team (at) simplywallst.com.
This article by Simply Wall St is general in nature. We provide commentary based on historical data and analyst forecasts only using an unbiased methodology and our articles are not intended to be financial advice. It does not constitute a recommendation to buy or sell any stock, and does not take account of your objectives, or your financial situation. We aim to bring you long-term focused analysis driven by fundamental data. Note that our analysis may not factor in the latest price-sensitive company announcements or qualitative material. Simply Wall St has no position in any stocks mentioned.
