
 Yahoo Finance
 NOV Inc.'s (NYSE:NOV) Share Price Matching Investor Opinion
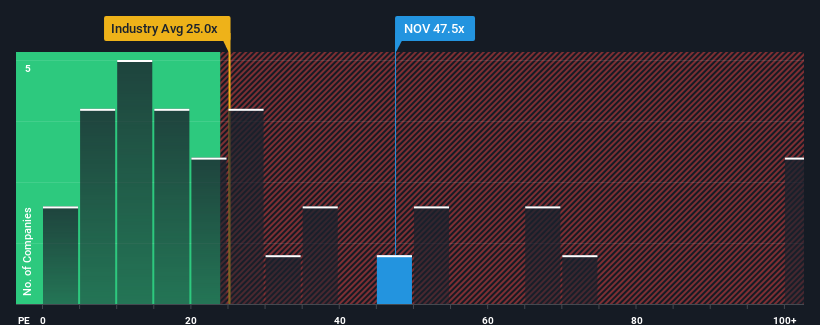
NOV Inc.'s (NYSE:NOV) price-to-earnings (or "P/E") ratio of 47.5x might make it look like a strong sell right now compared to the market in the United States, where around half of the companies have P/E ratios below 14x and even P/E's below 7x are quite common. However, the P/E might be quite high for a reason and it requires further investigation to determine if it's justified.
With earnings growth that's inferior to most other companies of late, NOV has been relatively sluggish. One possibility is that the P/E is high because investors think this lacklustre earnings performance will improve markedly. If not, then existing shareholders may be very nervous about the viability of the share price.
See our latest analysis for NOV
Keen to find out how analysts think NOV's future stacks up against the industry? In that case, our free report is a great place to start.
Is There Enough Growth For NOV?
In order to justify its P/E ratio, NOV would need to produce outstanding growth well in excess of the market.
Taking a look back first, we see that there was hardly any earnings per share growth to speak of for the company over the past year. The longer-term trend has been no better as the company has no earnings growth to show for over the last three years either. So it seems apparent to us that the company has struggled to grow earnings meaningfully over that time.
Shifting to the future, estimates from the analysts covering the company suggest earnings should grow by 70% each year over the next three years. With the market only predicted to deliver 9.8% per year, the company is positioned for a stronger earnings result.
In light of this, it's understandable that NOV's P/E sits above the majority of other companies. Apparently shareholders aren't keen to offload something that is potentially eyeing a more prosperous future.
The Bottom Line On NOV's P/E
Using the price-to-earnings ratio alone to determine if you should sell your stock isn't sensible, however it can be a practical guide to the company's future prospects.
As we suspected, our examination of NOV's analyst forecasts revealed that its superior earnings outlook is contributing to its high P/E. At this stage investors feel the potential for a deterioration in earnings isn't great enough to justify a lower P/E ratio. It's hard to see the share price falling strongly in the near future under these circumstances.
We don't want to rain on the parade too much, but we did also find 2 warning signs for NOV that you need to be mindful of.
You might be able to find a better investment than NOV. If you want a selection of possible candidates, check out this free list of interesting companies that trade on a low P/E (but have proven they can grow earnings).
Have feedback on this article? Concerned about the content? Get in touch with us directly. Alternatively, email editorial-team (at) simplywallst.com.
This article by Simply Wall St is general in nature. We provide commentary based on historical data and analyst forecasts only using an unbiased methodology and our articles are not intended to be financial advice. It does not constitute a recommendation to buy or sell any stock, and does not take account of your objectives, or your financial situation. We aim to bring you long-term focused analysis driven by fundamental data. Note that our analysis may not factor in the latest price-sensitive company announcements or qualitative material. Simply Wall St has no position in any stocks mentioned.
Join A Paid User Research Session
You’ll receive a US$30 Amazon Gift card for 1 hour of your time while helping us build better investing tools for the individual investors like yourself. Sign up here
