
 Yahoo Finance
 Not Many Are Piling Into Flow Capital Corp. (CVE:FW) Just Yet
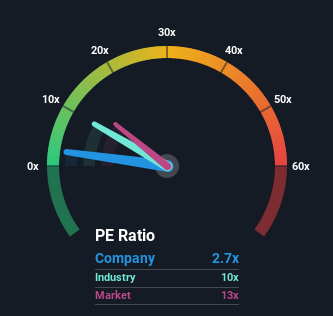
With a price-to-earnings (or "P/E") ratio of 2.7x Flow Capital Corp. (CVE:FW) may be sending very bullish signals at the moment, given that almost half of all companies in Canada have P/E ratios greater than 14x and even P/E's higher than 32x are not unusual. However, the P/E might be quite low for a reason and it requires further investigation to determine if it's justified.
Recent times have been quite advantageous for Flow Capital as its earnings have been rising very briskly. It might be that many expect the strong earnings performance to degrade substantially, which has repressed the P/E. If you like the company, you'd be hoping this isn't the case so that you could potentially pick up some stock while it's out of favour.
See our latest analysis for Flow Capital
We don't have analyst forecasts, but you can see how recent trends are setting up the company for the future by checking out our free report on Flow Capital's earnings, revenue and cash flow.
Is There Any Growth For Flow Capital?
The only time you'd be truly comfortable seeing a P/E as depressed as Flow Capital's is when the company's growth is on track to lag the market decidedly.
Taking a look back first, we see that the company grew earnings per share by an impressive 197% last year. The latest three year period has also seen an excellent 55% overall rise in EPS, aided by its short-term performance. Accordingly, shareholders would have probably welcomed those medium-term rates of earnings growth.
Weighing that recent medium-term earnings trajectory against the broader market's one-year forecast for expansion of 12% shows it's noticeably more attractive on an annualised basis.
With this information, we find it odd that Flow Capital is trading at a P/E lower than the market. It looks like most investors are not convinced the company can maintain its recent growth rates.
The Bottom Line On Flow Capital's P/E
Generally, our preference is to limit the use of the price-to-earnings ratio to establishing what the market thinks about the overall health of a company.
Our examination of Flow Capital revealed its three-year earnings trends aren't contributing to its P/E anywhere near as much as we would have predicted, given they look better than current market expectations. When we see strong earnings with faster-than-market growth, we assume potential risks are what might be placing significant pressure on the P/E ratio. It appears many are indeed anticipating earnings instability, because the persistence of these recent medium-term conditions would normally provide a boost to the share price.
There are also other vital risk factors to consider and we've discovered 3 warning signs for Flow Capital (2 don't sit too well with us!) that you should be aware of before investing here.
Of course, you might also be able to find a better stock than Flow Capital. So you may wish to see this free collection of other companies that sit on P/E's below 20x and have grown earnings strongly.
Have feedback on this article? Concerned about the content? Get in touch with us directly. Alternatively, email editorial-team (at) simplywallst.com.
This article by Simply Wall St is general in nature. We provide commentary based on historical data and analyst forecasts only using an unbiased methodology and our articles are not intended to be financial advice. It does not constitute a recommendation to buy or sell any stock, and does not take account of your objectives, or your financial situation. We aim to bring you long-term focused analysis driven by fundamental data. Note that our analysis may not factor in the latest price-sensitive company announcements or qualitative material. Simply Wall St has no position in any stocks mentioned.
