
 Yahoo Finance
 Not Many Are Piling Into Amyris, Inc. (NASDAQ:AMRS) Just Yet
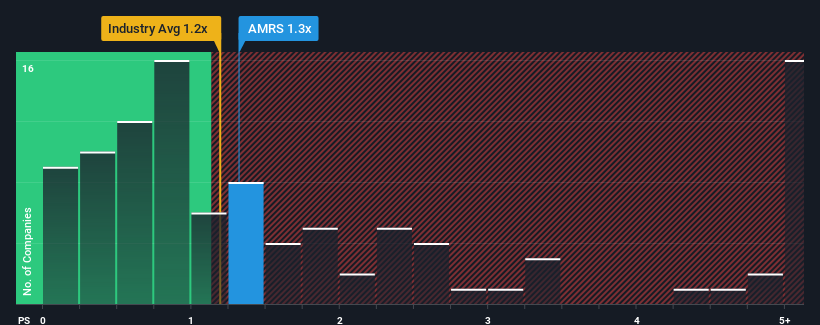
There wouldn't be many who think Amyris, Inc.'s (NASDAQ:AMRS) price-to-sales (or "P/S") ratio of 1.3x is worth a mention when the median P/S for the Chemicals industry in the United States is similar at about 1.2x. However, investors might be overlooking a clear opportunity or potential setback if there is no rational basis for the P/S.
View our latest analysis for Amyris
How Amyris Has Been Performing
Amyris could be doing better as its revenue has been going backwards lately while most other companies have been seeing positive revenue growth. Perhaps the market is expecting its poor revenue performance to improve, keeping the P/S from dropping. You'd really hope so, otherwise you're paying a relatively elevated price for a company with this sort of growth profile.
Keen to find out how analysts think Amyris' future stacks up against the industry? In that case, our free report is a great place to start.
How Is Amyris' Revenue Growth Trending?
The only time you'd be comfortable seeing a P/S like Amyris' is when the company's growth is tracking the industry closely.
In reviewing the last year of financials, we were disheartened to see the company's revenues fell to the tune of 21%. Even so, admirably revenue has lifted 77% in aggregate from three years ago, notwithstanding the last 12 months. Although it's been a bumpy ride, it's still fair to say the revenue growth recently has been more than adequate for the company.
Shifting to the future, estimates from the seven analysts covering the company suggest revenue should grow by 37% per year over the next three years. That's shaping up to be materially higher than the 6.8% per annum growth forecast for the broader industry.
With this information, we find it interesting that Amyris is trading at a fairly similar P/S compared to the industry. Apparently some shareholders are skeptical of the forecasts and have been accepting lower selling prices.
What Does Amyris' P/S Mean For Investors?
It's argued the price-to-sales ratio is an inferior measure of value within certain industries, but it can be a powerful business sentiment indicator.
Despite enticing revenue growth figures that outpace the industry, Amyris' P/S isn't quite what we'd expect. When we see a strong revenue outlook, with growth outpacing the industry, we can only assume potential uncertainty around these figures are what might be placing slight pressure on the P/S ratio. This uncertainty seems to be reflected in the share price which, while stable, could be higher given the revenue forecasts.
Don't forget that there may be other risks. For instance, we've identified 5 warning signs for Amyris (2 shouldn't be ignored) you should be aware of.
If you're unsure about the strength of Amyris' business, why not explore our interactive list of stocks with solid business fundamentals for some other companies you may have missed.
Have feedback on this article? Concerned about the content? Get in touch with us directly. Alternatively, email editorial-team (at) simplywallst.com.
This article by Simply Wall St is general in nature. We provide commentary based on historical data and analyst forecasts only using an unbiased methodology and our articles are not intended to be financial advice. It does not constitute a recommendation to buy or sell any stock, and does not take account of your objectives, or your financial situation. We aim to bring you long-term focused analysis driven by fundamental data. Note that our analysis may not factor in the latest price-sensitive company announcements or qualitative material. Simply Wall St has no position in any stocks mentioned.
Join A Paid User Research Session
You’ll receive a US$30 Amazon Gift card for 1 hour of your time while helping us build better investing tools for the individual investors like yourself. Sign up here
