
 Yahoo Finance
 Nordic American Tankers (NYSE:NAT) Could Be At Risk Of Shrinking As A Company
When researching a stock for investment, what can tell us that the company is in decline? A business that's potentially in decline often shows two trends, a return on capital employed (ROCE) that's declining, and a base of capital employed that's also declining. Trends like this ultimately mean the business is reducing its investments and also earning less on what it has invested. Having said that, after a brief look, Nordic American Tankers (NYSE:NAT) we aren't filled with optimism, but let's investigate further.
Return On Capital Employed (ROCE): What is it?
For those that aren't sure what ROCE is, it measures the amount of pre-tax profits a company can generate from the capital employed in its business. To calculate this metric for Nordic American Tankers, this is the formula:
Return on Capital Employed = Earnings Before Interest and Tax (EBIT) ÷ (Total Assets - Current Liabilities)
0.017 = US$15m ÷ (US$949m - US$42m) (Based on the trailing twelve months to March 2021).
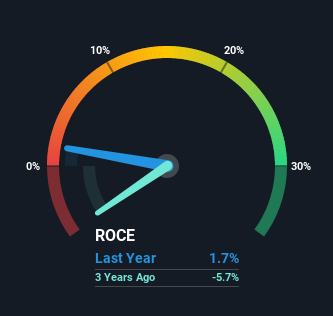
Thus, Nordic American Tankers has an ROCE of 1.7%. In absolute terms, that's a low return and it also under-performs the Oil and Gas industry average of 6.8%.
Check out our latest analysis for Nordic American Tankers
Above you can see how the current ROCE for Nordic American Tankers compares to its prior returns on capital, but there's only so much you can tell from the past. If you'd like to see what analysts are forecasting going forward, you should check out our free report for Nordic American Tankers.
What Can We Tell From Nordic American Tankers' ROCE Trend?
The trend of returns that Nordic American Tankers is generating are raising some concerns. The company used to generate 11% on its capital five years ago but it has since fallen noticeably. On top of that, the business is utilizing 25% less capital within its operations. When you see both ROCE and capital employed diminishing, it can often be a sign of a mature and shrinking business that might be in structural decline. If these underlying trends continue, we wouldn't be too optimistic going forward.
The Bottom Line On Nordic American Tankers' ROCE
In summary, it's unfortunate that Nordic American Tankers is shrinking its capital base and also generating lower returns. Investors haven't taken kindly to these developments, since the stock has declined 70% from where it was five years ago. That being the case, unless the underlying trends revert to a more positive trajectory, we'd consider looking elsewhere.
On a final note, we found 3 warning signs for Nordic American Tankers (1 shouldn't be ignored) you should be aware of.
For those who like to invest in solid companies, check out this free list of companies with solid balance sheets and high returns on equity.
This article by Simply Wall St is general in nature. We provide commentary based on historical data and analyst forecasts only using an unbiased methodology and our articles are not intended to be financial advice. It does not constitute a recommendation to buy or sell any stock, and does not take account of your objectives, or your financial situation. We aim to bring you long-term focused analysis driven by fundamental data. Note that our analysis may not factor in the latest price-sensitive company announcements or qualitative material. Simply Wall St has no position in any stocks mentioned.
Have feedback on this article? Concerned about the content? Get in touch with us directly. Alternatively, email editorial-team (at) simplywallst.com.
