
 Yahoo Finance
 Nielsen's (NLSN) Q4 Earnings Match Estimates, Revenues Beat
Nielsen Holdings plc NLSN reported fourth-quarter 2019 adjusted net earnings of 41 cents per share, which matched the Zacks Consensus Estimate. Further, the bottom line was down 19.6% from the year-ago quarter.
Total revenues came in at $1.69 billion, which improved 2% year over year. The figure also improved 2.7% on a constant-currency basis. Further, the top line surpassed the Zacks Consensus Estimate of $1.67 billion.
Solid momentum across Plan/Optimize and Predict/Activate drove year-over-year top line.
As part of the ongoing strategic review plan, the company announced the separation of Global Media and Global Connect businesses into two independent publicly-traded companies - the Global Media business and the Global Connect business in November 2019.
Segments Details
Nielsen Global Media: The company generated revenues of $889 million (accounting for 52.6% of its total revenues) from this segment, reflecting an improvement of 2.3% from the year-ago level or 2.4% on a constant-currency basis. We note that Audience Measurement revenues increased 0.8% year over year to $623 million, thanks to growing client adoption of Nielsen’s Total Audience Measurement system.
Further, Plan/Optimize revenues were $266 million, which increased 6% year over year courtesy of growth at Gracenote and solid momentum across outcome-based solutions.
Nielsen Global Connect: The company generated revenues of $802 million (47.4% of total revenues), reflecting growth of 1.6% from the year-ago period. The figure also surged 3% on a constant-currency basis.
Revenues in Measure came in $546 million, increasing 0.6% year over year driven by improving trends in developed markets. Moreover, strong performance of retail measurement services remained positive.
Further, Predict/Activate revenues increased 4.1% from the year-ago quarter to $256 million. This can be attributed to strengthening momentum across analytics and innovation.
Nielsen Holdings Plc Price, Consensus and EPS Surprise
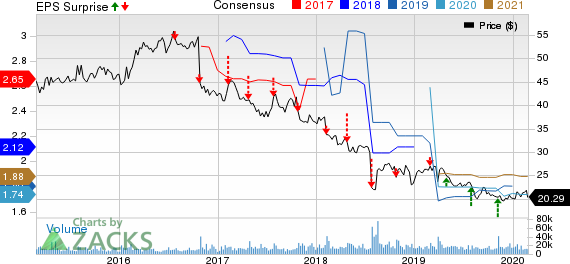
Nielsen Holdings Plc price-consensus-eps-surprise-chart | Nielsen Holdings Plc Quote
Operating Results
Adjusted EBITDA was $492 million in the fourth quarter, improving 0.8% from the prior-year level. However, adjusted EBITDA margin contracted 33 basis points (bps) to 29.1% as productivity initiatives were offset by investments in growth initiatives.
Nielsen’s selling, general and administrative expenses were $499 million, decreasing 1.6% from the year-ago figure. As a percentage of revenues, the figure contracted 110 bps year over year to 29.5%.
Per the company reported, operating income was $224 million against operating loss of $1.2 billion in the year-ago quarter.
Balance Sheet & Cash Flow
As of Dec 31, 2019, cash and cash equivalents balance was $454 million, up from $389 million as of Sep 30, 2019.
At the end of fourth quarter, gross debt was $8.31 billion compared with $8.49 billion at the end of the prior quarter. Net debt (gross debt excluding cash and cash equivalents) was $7.86 billion and net debt leverage ratio was 4.24 at the end of the reported quarter.
Cash flow from operations was $470 million, up from $413 million in the previous quarter. Further, capex totaled $177 million and free cash flow amounted to $293 million in the fourth quarter.
2020 Guidance
The company expects 2020 revenues to growth within the range of 1.5-3% on constant-currency basis. The Zacks Consensus Estimate for revenues is pegged at $6.58 billion.
Further, adjusted earnings are expected between $1.67 and $1.80 per share. The Zacks Consensus Estimate for earnings is pegged at $1.74 per share.
Adjusted EBITDA is anticipated in the range of $1.83-$1.91 billion. Adjusted EBTDA margin is expected between 27.7% and 28.5%.
Additionally, Nielsen expects free cash flow in the range of $530-$580 million.
Zacks Rank & Key Picks
Nielsen currently has a Zacks Rank #3 (Hold).
Some better-ranked stocks in the broader technology sector include Dropbox, Inc. DBX, ManTech International Corporation MANT and Alteryx, Inc. AYX. While Dropbox and ManTech sport a Zacks Rank #1 (Strong Buy), Alteryx carry a Zacks Rank #2 (Buy). You can see the complete list of today’s Zacks #1 Rank stocks here.
The long-term earnings growth rate for Dropbox, ManTech and Alteryx is currently projected to be 22.2%, 8% and 50.59, respectively.
Today's Best Stocks from Zacks
Would you like to see the updated picks from our best market-beating strategies? From 2017 through 2019, while the S&P 500 gained an impressive +53.6%, five of our strategies returned +65.8%, +97.1%, +118.0%, +175.7% and even +186.7%.
This outperformance has not just been a recent phenomenon. From 2000 – 2019, while the S&P averaged +6.0% per year, our top strategies averaged up to +54.7% per year.
See their latest picks free >>
Want the latest recommendations from Zacks Investment Research? Today, you can download 7 Best Stocks for the Next 30 Days. Click to get this free report
ManTech International Corporation (MANT) : Free Stock Analysis Report
Nielsen Holdings Plc (NLSN) : Free Stock Analysis Report
Alteryx, Inc. (AYX) : Free Stock Analysis Report
Dropbox, Inc. (DBX) : Free Stock Analysis Report
To read this article on Zacks.com click here.
Zacks Investment Research
