
 Yahoo Finance
 When Will NEXGEL, Inc. (NASDAQ:NXGL) Breakeven?
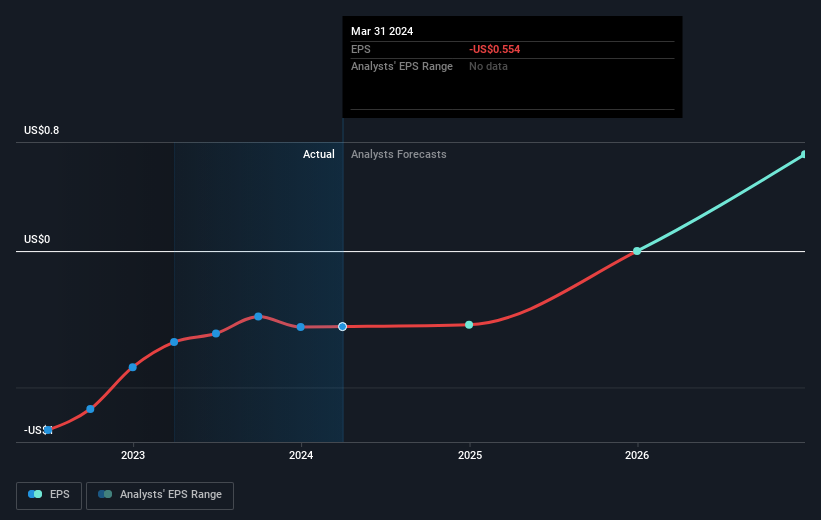
We feel now is a pretty good time to analyse NEXGEL, Inc.'s (NASDAQ:NXGL) business as it appears the company may be on the cusp of a considerable accomplishment. NEXGEL, Inc. manufactures and sells high water content, electron beam cross-linked, and aqueous polymer hydrogels and gels for wound care, medical diagnostics, transdermal drug delivery, and cosmetics in the United States. The US$13m market-cap company posted a loss in its most recent financial year of US$3.2m and a latest trailing-twelve-month loss of US$3.2m leading to an even wider gap between loss and breakeven. Many investors are wondering about the rate at which NEXGEL will turn a profit, with the big question being “when will the company breakeven?” In this article, we will touch on the expectations for the company's growth and when analysts expect it to become profitable.
View our latest analysis for NEXGEL
NEXGEL is bordering on breakeven, according to some American Medical Equipment analysts. They anticipate the company to incur a final loss in 2025, before generating positive profits of US$4.5m in 2026. So, the company is predicted to breakeven approximately 2 years from today. In order to meet this breakeven date, we calculated the rate at which the company must grow year-on-year. It turns out an average annual growth rate of 68% is expected, which signals high confidence from analysts. If this rate turns out to be too aggressive, the company may become profitable much later than analysts predict.
We're not going to go through company-specific developments for NEXGEL given that this is a high-level summary, though, take into account that typically a high forecast growth rate is not unusual for a company that is currently undergoing an investment period.
Before we wrap up, there’s one aspect worth mentioning. The company has managed its capital prudently, with debt making up 14% of equity. This means that it has predominantly funded its operations from equity capital, and its low debt obligation reduces the risk around investing in the loss-making company.
Next Steps:
There are too many aspects of NEXGEL to cover in one brief article, but the key fundamentals for the company can all be found in one place – NEXGEL's company page on Simply Wall St. We've also put together a list of pertinent factors you should further examine:
Historical Track Record: What has NEXGEL's performance been like over the past? Go into more detail in the past track record analysis and take a look at the free visual representations of our analysis for more clarity.
Management Team: An experienced management team on the helm increases our confidence in the business – take a look at who sits on NEXGEL's board and the CEO’s background.
Other High-Performing Stocks: Are there other stocks that provide better prospects with proven track records? Explore our free list of these great stocks here.
Have feedback on this article? Concerned about the content? Get in touch with us directly. Alternatively, email editorial-team (at) simplywallst.com.
This article by Simply Wall St is general in nature. We provide commentary based on historical data and analyst forecasts only using an unbiased methodology and our articles are not intended to be financial advice. It does not constitute a recommendation to buy or sell any stock, and does not take account of your objectives, or your financial situation. We aim to bring you long-term focused analysis driven by fundamental data. Note that our analysis may not factor in the latest price-sensitive company announcements or qualitative material. Simply Wall St has no position in any stocks mentioned.
Have feedback on this article? Concerned about the content? Get in touch with us directly. Alternatively, email editorial-team@simplywallst.com
