
 Yahoo Finance
 Newpark Resources' (NYSE:NR) Returns On Capital Not Reflecting Well On The Business
When it comes to investing, there are some useful financial metrics that can warn us when a business is potentially in trouble. Businesses in decline often have two underlying trends, firstly, a declining return on capital employed (ROCE) and a declining base of capital employed. This reveals that the company isn't compounding shareholder wealth because returns are falling and its net asset base is shrinking. Having said that, after a brief look, Newpark Resources (NYSE:NR) we aren't filled with optimism, but let's investigate further.
Return On Capital Employed (ROCE): What Is It?
Just to clarify if you're unsure, ROCE is a metric for evaluating how much pre-tax income (in percentage terms) a company earns on the capital invested in its business. The formula for this calculation on Newpark Resources is:
Return on Capital Employed = Earnings Before Interest and Tax (EBIT) ÷ (Total Assets - Current Liabilities)
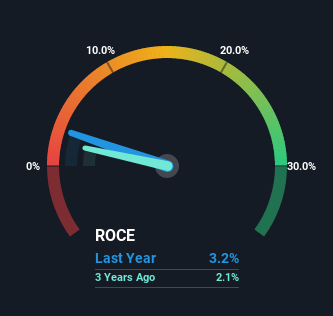
0.032 = US$18m ÷ (US$715m - US$163m) (Based on the trailing twelve months to December 2022).
Therefore, Newpark Resources has an ROCE of 3.2%. Ultimately, that's a low return and it under-performs the Energy Services industry average of 9.9%.
View our latest analysis for Newpark Resources
While the past is not representative of the future, it can be helpful to know how a company has performed historically, which is why we have this chart above. If you want to delve into the historical earnings, revenue and cash flow of Newpark Resources, check out these free graphs here.
How Are Returns Trending?
The trend of ROCE at Newpark Resources is showing some signs of weakness. Unfortunately, returns have declined substantially over the last five years to the 3.2% we see today. What's equally concerning is that the amount of capital deployed in the business has shrunk by 26% over that same period. The fact that both are shrinking is an indication that the business is going through some tough times. If these underlying trends continue, we wouldn't be too optimistic going forward.
The Key Takeaway
To see Newpark Resources reducing the capital employed in the business in tandem with diminishing returns, is concerning. Long term shareholders who've owned the stock over the last five years have experienced a 61% depreciation in their investment, so it appears the market might not like these trends either. With underlying trends that aren't great in these areas, we'd consider looking elsewhere.
If you'd like to know about the risks facing Newpark Resources, we've discovered 2 warning signs that you should be aware of.
If you want to search for solid companies with great earnings, check out this free list of companies with good balance sheets and impressive returns on equity.
Have feedback on this article? Concerned about the content? Get in touch with us directly. Alternatively, email editorial-team (at) simplywallst.com.
This article by Simply Wall St is general in nature. We provide commentary based on historical data and analyst forecasts only using an unbiased methodology and our articles are not intended to be financial advice. It does not constitute a recommendation to buy or sell any stock, and does not take account of your objectives, or your financial situation. We aim to bring you long-term focused analysis driven by fundamental data. Note that our analysis may not factor in the latest price-sensitive company announcements or qualitative material. Simply Wall St has no position in any stocks mentioned.
Join A Paid User Research Session
You’ll receive a US$30 Amazon Gift card for 1 hour of your time while helping us build better investing tools for the individual investors like yourself. Sign up here
