
 Yahoo Finance
 Newpark Resources' (NYSE:NR) Returns On Capital Not Reflecting Well On The Business
What financial metrics can indicate to us that a company is maturing or even in decline? Businesses in decline often have two underlying trends, firstly, a declining return on capital employed (ROCE) and a declining base of capital employed. This combination can tell you that not only is the company investing less, it's earning less on what it does invest. On that note, looking into Newpark Resources (NYSE:NR), we weren't too upbeat about how things were going.
What Is Return On Capital Employed (ROCE)?
For those that aren't sure what ROCE is, it measures the amount of pre-tax profits a company can generate from the capital employed in its business. Analysts use this formula to calculate it for Newpark Resources:
Return on Capital Employed = Earnings Before Interest and Tax (EBIT) ÷ (Total Assets - Current Liabilities)
0.012 = US$7.3m ÷ (US$767m - US$173m) (Based on the trailing twelve months to September 2022).
Thus, Newpark Resources has an ROCE of 1.2%. In absolute terms, that's a low return and it also under-performs the Energy Services industry average of 6.0%.
See our latest analysis for Newpark Resources
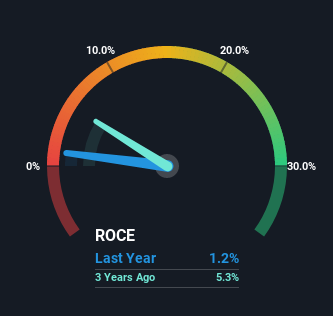
Historical performance is a great place to start when researching a stock so above you can see the gauge for Newpark Resources' ROCE against it's prior returns. If you'd like to look at how Newpark Resources has performed in the past in other metrics, you can view this free graph of past earnings, revenue and cash flow.
What The Trend Of ROCE Can Tell Us
There is reason to be cautious about Newpark Resources, given the returns are trending downwards. Unfortunately the returns on capital have diminished from the 1.8% that they were earning five years ago. And on the capital employed front, the business is utilizing roughly the same amount of capital as it was back then. This combination can be indicative of a mature business that still has areas to deploy capital, but the returns received aren't as high due potentially to new competition or smaller margins. So because these trends aren't typically conducive to creating a multi-bagger, we wouldn't hold our breath on Newpark Resources becoming one if things continue as they have.
Our Take On Newpark Resources' ROCE
In summary, it's unfortunate that Newpark Resources is generating lower returns from the same amount of capital. Long term shareholders who've owned the stock over the last five years have experienced a 63% depreciation in their investment, so it appears the market might not like these trends either. With underlying trends that aren't great in these areas, we'd consider looking elsewhere.
If you want to continue researching Newpark Resources, you might be interested to know about the 2 warning signs that our analysis has discovered.
While Newpark Resources isn't earning the highest return, check out this free list of companies that are earning high returns on equity with solid balance sheets.
Have feedback on this article? Concerned about the content? Get in touch with us directly. Alternatively, email editorial-team (at) simplywallst.com.
This article by Simply Wall St is general in nature. We provide commentary based on historical data and analyst forecasts only using an unbiased methodology and our articles are not intended to be financial advice. It does not constitute a recommendation to buy or sell any stock, and does not take account of your objectives, or your financial situation. We aim to bring you long-term focused analysis driven by fundamental data. Note that our analysis may not factor in the latest price-sensitive company announcements or qualitative material. Simply Wall St has no position in any stocks mentioned.
Join A Paid User Research Session
You’ll receive a US$30 Amazon Gift card for 1 hour of your time while helping us build better investing tools for the individual investors like yourself. Sign up here
