
 Yahoo Finance
 Newmont's (NEM) Q1 Earnings and Revenues Beat Estimates
Newmont Corporation NEM reported first-quarter 2024 earnings from continuing operations of 15 cents per share compared with 42 cents in the year-ago quarter.
Barring one-time items, adjusted earnings were 55 cents per share compared with 40 cents reported in the prior-year quarter. It topped the Zacks Consensus Estimate of 35 cents.
NEM’s revenues for the first quarter were $4,023 million, up 50.2% from $2,679 million reported in the prior-year quarter. The figure topped the Zacks Consensus Estimate of $3,398.7 million. The increase in the top line was primarily due to higher year-over-year production and realized gold prices.
Newmont Corporation Price, Consensus and EPS Surprise
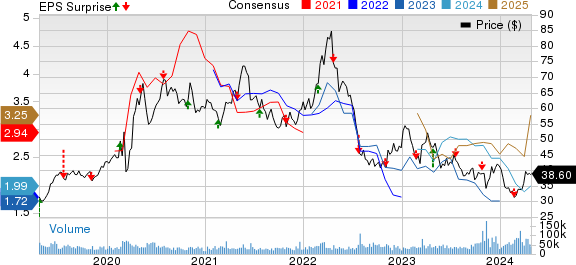
Newmont Corporation price-consensus-eps-surprise-chart | Newmont Corporation Quote
Operational Highlights
Newmont's attributable gold production in the first quarter of 1.68 million ounces was 32.3% higher than the prior-year quarter’s figure. The figure was in line with our estimate.
Average realized prices of gold rose around 9.7% year over year to $2,090 per ounce. The figure topped our estimate of $1,900 per ounce.
The company’s costs applicable to sales (CAS) for gold were $1,057 per ounce, up 3.1% year over year. The figure was above our estimate of $1,038 per ounce.
All-in-sustaining costs (AISC) for gold were up around 4.6% year over year to $1,439 per ounce. The figure was above our estimate of $1,363 per ounce.
Financials
The company ended the quarter with cash and cash equivalents of $2,336 million, down 12% year over year. At the end of the quarter, the company had a long-term debt of $8,933 million, up 60.3% year over year.
Net cash from continuing operations amounted to $776 million in the reported quarter, up from $481 million in the year-ago quarter.
Outlook
Newmont anticipates maintaining its expected gold production for 2024 at about 6.9 million ounces. The company also projects a cost of sales (CAS) for gold at $1,050 per ounce and an all-in sustaining cost (AISC) of $1,400 per ounce.
Price Performance
Newmont’s shares have lost 18.1% in the past year compared with a 10.2% rise of the industry.
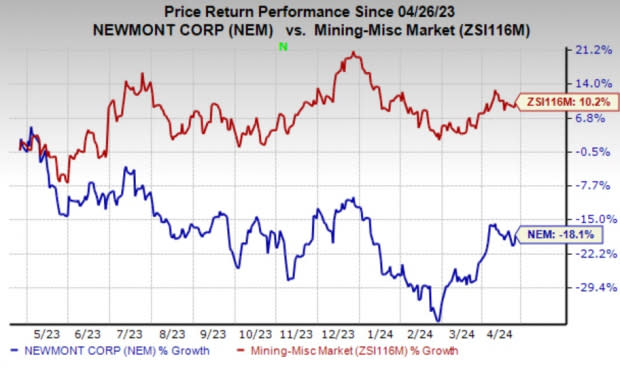
Image Source: Zacks Investment Research
Zacks Rank & Key Picks
Newmont currently carries a Zacks Rank #3 (Hold).
Some better-ranked stocks in the Basic Materials space are Gold Fields Limited GFI, sporting a Zacks Rank #1 (Strong Buy), and Carpenter Technology Corporation CRS and Ecolab Inc. ECL, each carrying a Zacks Rank #2 (Buy) at present. You can see the complete list of today’s Zacks #1 Rank stocks here.
The consensus estimate for GFI’s current year earnings is pegged at $1.53 per share, indicating a 64.5% year-over-year increase. The Zacks Consensus Estimate for GFI’s current-year earnings has been revised upward by 33% in the past 60 days. The company’s shares have increased 10.6% in the past year.
The consensus estimate for CRS’ current fiscal year earnings is pegged at $3.96 per share, indicating a year-over-year surge of 247.37%. CRS beat on earnings in each of the last four quarters, delivering an average surprise of 12.2%. The company’s shares have risen 66.7% in the past year.
The consensus estimate for ECL’s current year earnings is pegged at $6.42 per share, indicating a year-over-year surge of 23.22%. ECL beat on earnings in each of the last four quarters, delivering an average surprise of 1.7%. The company’s shares have rallied 35.8% in the past year.
Want the latest recommendations from Zacks Investment Research? Today, you can download 7 Best Stocks for the Next 30 Days. Click to get this free report
Ecolab Inc. (ECL) : Free Stock Analysis Report
Newmont Corporation (NEM) : Free Stock Analysis Report
Carpenter Technology Corporation (CRS) : Free Stock Analysis Report
Gold Fields Limited (GFI) : Free Stock Analysis Report
