
 Yahoo Finance
 Newmont Corporation's (ASX:NEM) Business And Shares Still Trailing The Industry
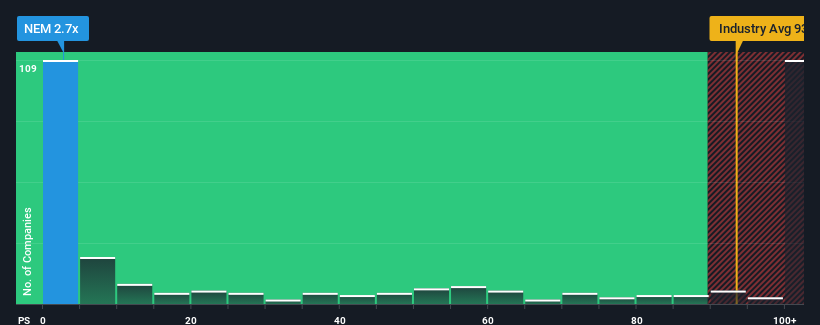
Newmont Corporation's (ASX:NEM) price-to-sales (or "P/S") ratio of 2.7x might make it look like a strong buy right now compared to the Metals and Mining industry in Australia, where around half of the companies have P/S ratios above 93.4x and even P/S above 523x are quite common. Although, it's not wise to just take the P/S at face value as there may be an explanation why it's so limited.
Check out our latest analysis for Newmont
How Newmont Has Been Performing
Newmont could be doing better as its revenue has been going backwards lately while most other companies have been seeing positive revenue growth. The P/S ratio is probably low because investors think this poor revenue performance isn't going to get any better. So while you could say the stock is cheap, investors will be looking for improvement before they see it as good value.
Keen to find out how analysts think Newmont's future stacks up against the industry? In that case, our free report is a great place to start.
How Is Newmont's Revenue Growth Trending?
There's an inherent assumption that a company should far underperform the industry for P/S ratios like Newmont's to be considered reasonable.
Retrospectively, the last year delivered a frustrating 8.7% decrease to the company's top line. This has erased any of its gains during the last three years, with practically no change in revenue being achieved in total. Accordingly, shareholders probably wouldn't have been overly satisfied with the unstable medium-term growth rates.
Looking ahead now, revenue is anticipated to climb by 22% each year during the coming three years according to the eleven analysts following the company. With the industry predicted to deliver 270% growth each year, the company is positioned for a weaker revenue result.
With this information, we can see why Newmont is trading at a P/S lower than the industry. Apparently many shareholders weren't comfortable holding on while the company is potentially eyeing a less prosperous future.
The Final Word
While the price-to-sales ratio shouldn't be the defining factor in whether you buy a stock or not, it's quite a capable barometer of revenue expectations.
We've established that Newmont maintains its low P/S on the weakness of its forecast growth being lower than the wider industry, as expected. Shareholders' pessimism on the revenue prospects for the company seems to be the main contributor to the depressed P/S. The company will need a change of fortune to justify the P/S rising higher in the future.
Before you settle on your opinion, we've discovered 1 warning sign for Newmont that you should be aware of.
It's important to make sure you look for a great company, not just the first idea you come across. So if growing profitability aligns with your idea of a great company, take a peek at this free list of interesting companies with strong recent earnings growth (and a low P/E).
Have feedback on this article? Concerned about the content? Get in touch with us directly. Alternatively, email editorial-team (at) simplywallst.com.
This article by Simply Wall St is general in nature. We provide commentary based on historical data and analyst forecasts only using an unbiased methodology and our articles are not intended to be financial advice. It does not constitute a recommendation to buy or sell any stock, and does not take account of your objectives, or your financial situation. We aim to bring you long-term focused analysis driven by fundamental data. Note that our analysis may not factor in the latest price-sensitive company announcements or qualitative material. Simply Wall St has no position in any stocks mentioned.
