
 Yahoo Finance
 NetEase's (NASDAQ:NTES) investors will be pleased with their impressive 171% return over the last five years
The worst result, after buying shares in a company (assuming no leverage), would be if you lose all the money you put in. But on a lighter note, a good company can see its share price rise well over 100%. Long term NetEase, Inc. (NASDAQ:NTES) shareholders would be well aware of this, since the stock is up 148% in five years.
So let's investigate and see if the longer term performance of the company has been in line with the underlying business' progress.
View our latest analysis for NetEase
There is no denying that markets are sometimes efficient, but prices do not always reflect underlying business performance. By comparing earnings per share (EPS) and share price changes over time, we can get a feel for how investor attitudes to a company have morphed over time.
During five years of share price growth, NetEase achieved compound earnings per share (EPS) growth of 35% per year. This EPS growth is higher than the 20% average annual increase in the share price. Therefore, it seems the market has become relatively pessimistic about the company.
The graphic below depicts how EPS has changed over time (unveil the exact values by clicking on the image).
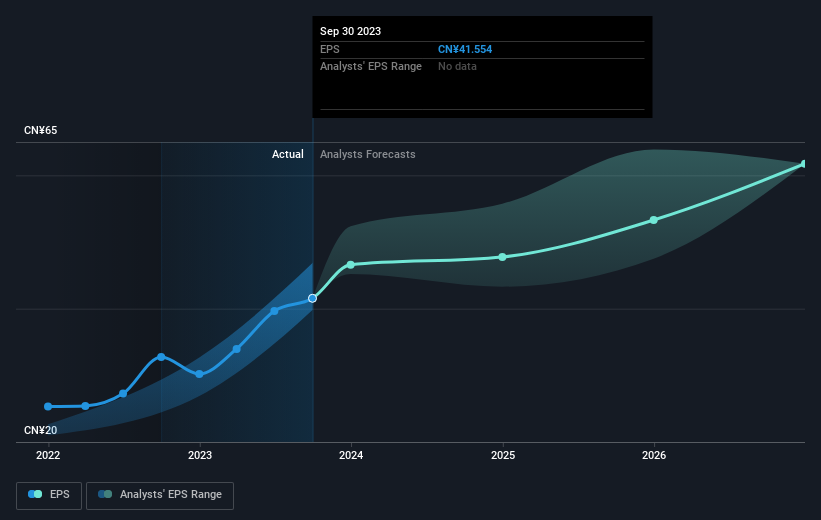
We know that NetEase has improved its bottom line lately, but is it going to grow revenue? If you're interested, you could check this free report showing consensus revenue forecasts.
What About Dividends?
As well as measuring the share price return, investors should also consider the total shareholder return (TSR). Whereas the share price return only reflects the change in the share price, the TSR includes the value of dividends (assuming they were reinvested) and the benefit of any discounted capital raising or spin-off. It's fair to say that the TSR gives a more complete picture for stocks that pay a dividend. We note that for NetEase the TSR over the last 5 years was 171%, which is better than the share price return mentioned above. This is largely a result of its dividend payments!
A Different Perspective
It's good to see that NetEase has rewarded shareholders with a total shareholder return of 40% in the last twelve months. Of course, that includes the dividend. That's better than the annualised return of 22% over half a decade, implying that the company is doing better recently. Given the share price momentum remains strong, it might be worth taking a closer look at the stock, lest you miss an opportunity. Before deciding if you like the current share price, check how NetEase scores on these 3 valuation metrics.
Of course NetEase may not be the best stock to buy. So you may wish to see this free collection of growth stocks.
Please note, the market returns quoted in this article reflect the market weighted average returns of stocks that currently trade on American exchanges.
Have feedback on this article? Concerned about the content? Get in touch with us directly. Alternatively, email editorial-team (at) simplywallst.com.
This article by Simply Wall St is general in nature. We provide commentary based on historical data and analyst forecasts only using an unbiased methodology and our articles are not intended to be financial advice. It does not constitute a recommendation to buy or sell any stock, and does not take account of your objectives, or your financial situation. We aim to bring you long-term focused analysis driven by fundamental data. Note that our analysis may not factor in the latest price-sensitive company announcements or qualitative material. Simply Wall St has no position in any stocks mentioned.
