
 Yahoo Finance
 Myriad Genetics (MYGN) Lags Q1 Earnings, Updates '23 View
Myriad Genetics, Inc. MYGN reported an adjusted loss of 21 cents per share in the first quarter of 2023, significantly wider than the year-ago quarter’s loss of 3 cents per share. The metric also came in wider than the Zacks Consensus Estimate of a loss of 19 cents per share.
The quarter’s adjustments exclude amortization expenses from the acquisition of intangible assets, transitory costs related to transformation initiatives and equity compensations, among others.
The GAAP loss was 67 cents per share compared with the prior-year quarter’s loss of 26 cents.
Revenues
Total revenues rose 9.9% year over year to $181.2 million in the quarter under review. The figure surpassed the Zacks Consensus Estimate by 5.7%.
Testing volumes grew 21% year over year and 11% sequentially, excluding the contribution from the Early Gender DNA Test.
Myriad Genetics, Inc. Price, Consensus and EPS Surprise
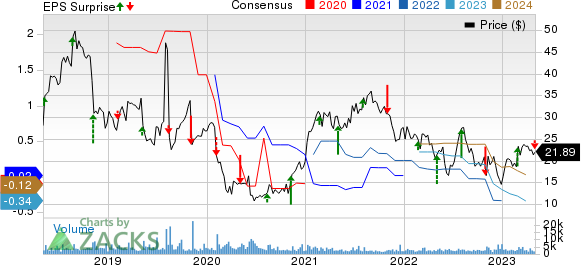
Myriad Genetics, Inc. price-consensus-eps-surprise-chart | Myriad Genetics, Inc. Quote
Quarter in Detail
Hereditary Cancer testing revenues rose 6.8% year over year to $75.7 million. Pharmacogenomics testing revenues were $32 million, up 9.2% year over year.
Tumor Profiling testing revenues were up 14.8% year over year to $37.3 million. Prenatal testing revenues came in at $36.2 million, up 13.5% year over year.
Margin Trends
The gross margin in the quarter under review contracted 356 basis points (bps) to 67.3%.
Research and development expenses rose 6.1% year over year to $22.5 million. SG&A expenses increased 37.2% to $151.7 million in the reported quarter.
The adjusted operating loss in the quarter was $52.2 million compared with the adjusted operating loss of $14.9 million in the year-ago quarter.
Financial Position
Myriad Genetics exited the first quarter of 2023 with cash and cash equivalents of $53.6 million compared with $56.9 million at the end of 2022. However, the company had no outstanding debt at the end of the first quarter.
The cumulative net cash used in operating activities at the end of the first quarter was $33.2 million compared with the year-ago cumulative net operating cash outflow of $46.5 million.
Guidance
Myriad Genetics updated its full-year 2023 guidance.
For 2023, the company expects revenues in the range of 730-$750 million (earlier $720-$750 million). This indicates the projected annual growth of 8%-11% (previously 6%-11%) over 2022. The Zacks Consensus Estimate for the same is pegged at $730.9 million.
The adjusted EPS is expected in the range of a loss of 36-24 cents (previously 40-20 cents). The Zacks Consensus Estimate for the metric is pegged at a loss of 24 cents per share.
Our Take
Myriad Genetics exited the first quarter of 2023 with lower-than-expected earnings and revenue beat. The company witnessed a strong testing volume improvement across all its businesses, with the Hereditary cancer testing franchise registering 32% year-over-year volume growth in the Women's Health segment.
Within the Mental Health segment, the GeneSight test also achieved a solid uptick in the quarter, bringing approximately 4,000 new clinicians to order the test for the first time. In 2023, MYGN plans to amplify the full potential of its existing products, while maintaining a pipeline of new products in development.
Meanwhile, Myriad Genetics’ collaboration with the medical imaging provider SimonMeD is expected to advance precision medicine with a new hereditary cancer assessment program. Leveraging a custom-built Myriad tool developed in collaboration with SimonMed, the program will enable affordable access to genetic testing to identify and elevate high-risk patient care.
Meanwhile, a gross margin contraction and an operating loss as a result of mounting costs and expenses are concerning. MYGN’s adjusted operating expenses for the quarter reflected investments in sales and marketing programs, technology, research and development, additional operating expenses from Gateway Genomics, and inflationary pressures.
Zacks Rank & Key Picks
Myriad Genetics currently carries a Zacks Rank #3 (Hold).
Some better-ranked stocks in the broader medical space that have announced quarterly results are Edwards Lifesciences Corporation EW, Intuitive Surgical, Inc. ISRG and Johnson & Johnson JNJ.
Edwards Lifesciences, carrying a Zacks Rank #2 (Buy), reported a first-quarter 2023 adjusted EPS of 62 cents, beating the Zacks Consensus Estimate by 1.6%. Revenues of $1.46 billion outpaced the consensus mark by 4.7%. You can see the complete list of today’s Zacks #1 Rank (Strong Buy) stocks here.
Edwards Lifesciences has a long-term estimated growth rate of 6.8%. EW’s earnings surpassed estimates in two of the trailing four quarters, missed the same in one and broke even in the other, the average being 1.2%.
Intuitive Surgical, having a Zacks Rank #2, reported a first-quarter 2023 adjusted EPS of $1.23, which beat the Zacks Consensus Estimate by 3.4%. Revenues of $1.70 billion outpaced the consensus mark by 6.9%.
Intuitive Surgical has a long-term estimated growth rate of 13%. ISRG’s earnings surpassed estimates in two of the trailing four quarters and missed the same in the other two, the average being 1.9%.
Johnson & Johnson reported first-quarter 2023 adjusted earnings of $2.68 per share, beating the Zacks Consensus Estimate by 6.8%. Revenues of $24.75 billion surpassed the Zacks Consensus Estimate by 5%. It currently carries a Zacks Rank #2.
Johnson & Johnson has a long-term estimated growth rate of 5.5%. JNJ’s earnings surpassed estimates in all the trailing four quarters, the average surprise being 3.9%.
Want the latest recommendations from Zacks Investment Research? Today, you can download 7 Best Stocks for the Next 30 Days. Click to get this free report
Myriad Genetics, Inc. (MYGN) : Free Stock Analysis Report
Johnson & Johnson (JNJ) : Free Stock Analysis Report
Intuitive Surgical, Inc. (ISRG) : Free Stock Analysis Report
Edwards Lifesciences Corporation (EW) : Free Stock Analysis Report
