
 Yahoo Finance
 Myer Holdings (ASX:MYR) Is Looking To Continue Growing Its Returns On Capital
Did you know there are some financial metrics that can provide clues of a potential multi-bagger? Amongst other things, we'll want to see two things; firstly, a growing return on capital employed (ROCE) and secondly, an expansion in the company's amount of capital employed. Put simply, these types of businesses are compounding machines, meaning they are continually reinvesting their earnings at ever-higher rates of return. With that in mind, we've noticed some promising trends at Myer Holdings (ASX:MYR) so let's look a bit deeper.
Understanding Return On Capital Employed (ROCE)
For those who don't know, ROCE is a measure of a company's yearly pre-tax profit (its return), relative to the capital employed in the business. To calculate this metric for Myer Holdings, this is the formula:
Return on Capital Employed = Earnings Before Interest and Tax (EBIT) ÷ (Total Assets - Current Liabilities)
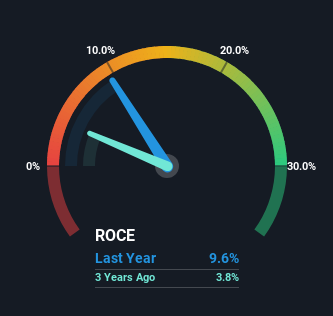
0.096 = AU$176m ÷ (AU$2.6b - AU$721m) (Based on the trailing twelve months to January 2024).
Therefore, Myer Holdings has an ROCE of 9.6%. Even though it's in line with the industry average of 9.6%, it's still a low return by itself.
View our latest analysis for Myer Holdings
In the above chart we have measured Myer Holdings' prior ROCE against its prior performance, but the future is arguably more important. If you'd like, you can check out the forecasts from the analysts covering Myer Holdings for free.
How Are Returns Trending?
Even though ROCE is still low in absolute terms, it's good to see it's heading in the right direction. The data shows that returns on capital have increased substantially over the last five years to 9.6%. The amount of capital employed has increased too, by 114%. So we're very much inspired by what we're seeing at Myer Holdings thanks to its ability to profitably reinvest capital.
One more thing to note, Myer Holdings has decreased current liabilities to 28% of total assets over this period, which effectively reduces the amount of funding from suppliers or short-term creditors. So this improvement in ROCE has come from the business' underlying economics, which is great to see.
What We Can Learn From Myer Holdings' ROCE
All in all, it's terrific to see that Myer Holdings is reaping the rewards from prior investments and is growing its capital base. Since the stock has only returned 34% to shareholders over the last five years, the promising fundamentals may not be recognized yet by investors. So with that in mind, we think the stock deserves further research.
On a final note, we've found 2 warning signs for Myer Holdings that we think you should be aware of.
While Myer Holdings may not currently earn the highest returns, we've compiled a list of companies that currently earn more than 25% return on equity. Check out this free list here.
Have feedback on this article? Concerned about the content? Get in touch with us directly. Alternatively, email editorial-team (at) simplywallst.com.
This article by Simply Wall St is general in nature. We provide commentary based on historical data and analyst forecasts only using an unbiased methodology and our articles are not intended to be financial advice. It does not constitute a recommendation to buy or sell any stock, and does not take account of your objectives, or your financial situation. We aim to bring you long-term focused analysis driven by fundamental data. Note that our analysis may not factor in the latest price-sensitive company announcements or qualitative material. Simply Wall St has no position in any stocks mentioned.
