
 Yahoo Finance
 What You Must Know About Secure Energy Services Inc.’s (TSE:SES) Financial Strength

Want to participate in a short research study? Help shape the future of investing tools and receive a $20 prize!
While small-cap stocks, such as Secure Energy Services Inc. (TSE:SES) with its market cap of CA$1.4b, are popular for their explosive growth, investors should also be aware of their balance sheet to judge whether the company can survive a downturn. Energy Services companies, in particular ones that run negative earnings, tend to be high risk. Evaluating financial health as part of your investment thesis is essential. Here are few basic financial health checks you should consider before taking the plunge. However, I know these factors are very high-level, so I suggest you dig deeper yourself into SES here.
How does SES’s operating cash flow stack up against its debt?
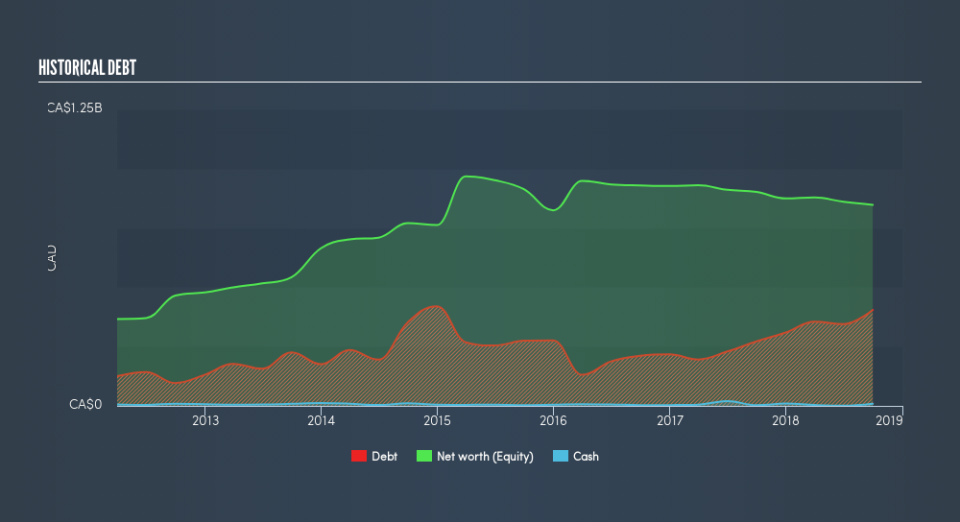
Over the past year, SES has ramped up its debt from CA$272m to CA$405m , which accounts for long term debt. With this rise in debt, SES currently has CA$9.6m remaining in cash and short-term investments for investing into the business. Moreover, SES has generated CA$150m in operating cash flow over the same time period, leading to an operating cash to total debt ratio of 37%, signalling that SES’s operating cash is sufficient to cover its debt. This ratio can also be interpreted as a measure of efficiency for unprofitable companies as traditional metrics such as return on asset (ROA) requires positive earnings. In SES’s case, it is able to generate 0.37x cash from its debt capital.
Can SES pay its short-term liabilities?
Looking at SES’s CA$222m in current liabilities, it appears that the company has maintained a safe level of current assets to meet its obligations, with the current ratio last standing at 1.67x. Generally, for Energy Services companies, this is a reasonable ratio as there’s enough of a cash buffer without holding too much capital in low return investments.
Does SES face the risk of succumbing to its debt-load?
With debt reaching 48% of equity, SES may be thought of as relatively highly levered. This is not unusual for small-caps as debt tends to be a cheaper and faster source of funding for some businesses. However, since SES is presently loss-making, sustainability of its current state of operations becomes a concern. Maintaining a high level of debt, while revenues are still below costs, can be dangerous as liquidity tends to dry up in unexpected downturns.
Next Steps:
Although SES’s debt level is towards the higher end of the spectrum, its cash flow coverage seems adequate to meet obligations which means its debt is being efficiently utilised. Since there is also no concerns around SES’s liquidity needs, this may be its optimal capital structure for the time being. Keep in mind I haven’t considered other factors such as how SES has been performing in the past. You should continue to research Secure Energy Services to get a more holistic view of the small-cap by looking at:
Future Outlook: What are well-informed industry analysts predicting for SES’s future growth? Take a look at our free research report of analyst consensus for SES’s outlook.
Valuation: What is SES worth today? Is the stock undervalued, even when its growth outlook is factored into its intrinsic value? The intrinsic value infographic in our free research report helps visualize whether SES is currently mispriced by the market.
Other High-Performing Stocks: Are there other stocks that provide better prospects with proven track records? Explore our free list of these great stocks here.
We aim to bring you long-term focused research analysis driven by fundamental data. Note that our analysis may not factor in the latest price-sensitive company announcements or qualitative material.
If you spot an error that warrants correction, please contact the editor at editorial-team@simplywallst.com. This article by Simply Wall St is general in nature. It does not constitute a recommendation to buy or sell any stock, and does not take account of your objectives, or your financial situation. Simply Wall St has no position in the stocks mentioned. Thank you for reading.
