
 Yahoo Finance
 What You Must Know About CVR Energy, Inc.'s (NYSE:CVI) Financial Strength
Want to participate in a research study? Help shape the future of investing tools and earn a $60 gift card!
Small-cap and large-cap companies receive a lot of attention from investors, but mid-cap stocks like CVR Energy, Inc. (NYSE:CVI), with a market cap of US$4.2b, are often out of the spotlight. However, history shows that overlooked mid-cap companies have performed better on a risk-adjusted manner than the smaller and larger segment of the market. Today we will look at CVI’s financial liquidity and debt levels, which are strong indicators for whether the company can weather economic downturns or fund strategic acquisitions for future growth. Remember this is a very top-level look that focuses exclusively on financial health, so I recommend a deeper analysis into CVI here.
See our latest analysis for CVR Energy
Does CVI Produce Much Cash Relative To Its Debt?
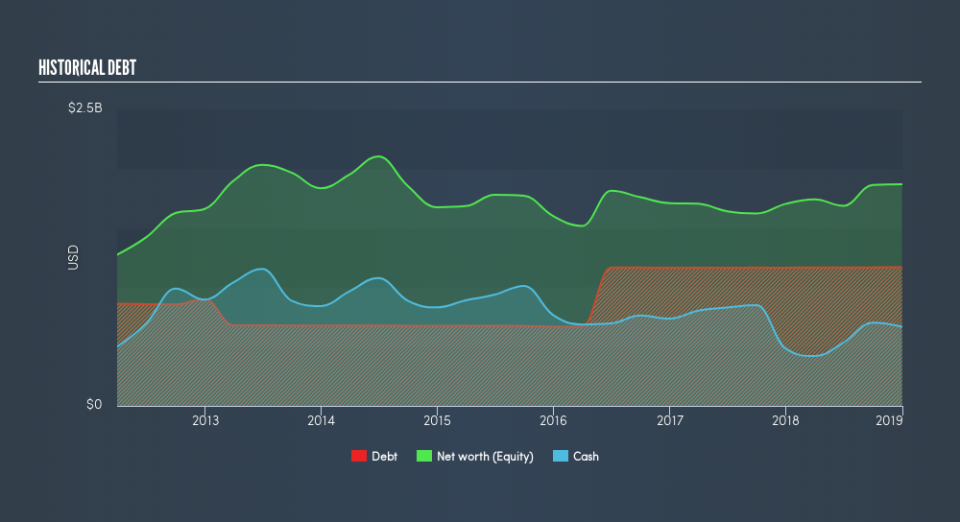
CVI's debt level has been constant at around US$1.2b over the previous year including long-term debt. At this current level of debt, CVI's cash and short-term investments stands at US$668m , ready to be used for running the business. Moreover, CVI has generated US$620m in operating cash flow in the last twelve months, leading to an operating cash to total debt ratio of 53%, indicating that CVI’s current level of operating cash is high enough to cover debt.
Does CVI’s liquid assets cover its short-term commitments?
Looking at CVI’s US$496m in current liabilities, the company has been able to meet these obligations given the level of current assets of US$1.3b, with a current ratio of 2.61x. The current ratio is calculated by dividing current assets by current liabilities. Generally, for Oil and Gas companies, this is a reasonable ratio as there's enough of a cash buffer without holding too much capital in low return investments.
Is CVI’s debt level acceptable?
With a debt-to-equity ratio of 63%, CVI can be considered as an above-average leveraged company. This is not uncommon for a mid-cap company given that debt tends to be lower-cost and at times, more accessible. We can check to see whether CVI is able to meet its debt obligations by looking at the net interest coverage ratio. A company generating earnings before interest and tax (EBIT) at least three times its net interest payments is considered financially sound. In CVI's, case, the ratio of 5.81x suggests that interest is appropriately covered, which means that lenders may be inclined to lend more money to the company, as it is seen as safe in terms of payback.
Next Steps:
Although CVI’s debt level is towards the higher end of the spectrum, its cash flow coverage seems adequate to meet obligations which means its debt is being efficiently utilised. Since there is also no concerns around CVI's liquidity needs, this may be its optimal capital structure for the time being. I admit this is a fairly basic analysis for CVI's financial health. Other important fundamentals need to be considered alongside. I suggest you continue to research CVR Energy to get a more holistic view of the mid-cap by looking at:
Future Outlook: What are well-informed industry analysts predicting for CVI’s future growth? Take a look at our free research report of analyst consensus for CVI’s outlook.
Valuation: What is CVI worth today? Is the stock undervalued, even when its growth outlook is factored into its intrinsic value? The intrinsic value infographic in our free research report helps visualize whether CVI is currently mispriced by the market.
Other High-Performing Stocks: Are there other stocks that provide better prospects with proven track records? Explore our free list of these great stocks here.
We aim to bring you long-term focused research analysis driven by fundamental data. Note that our analysis may not factor in the latest price-sensitive company announcements or qualitative material.
If you spot an error that warrants correction, please contact the editor at editorial-team@simplywallst.com. This article by Simply Wall St is general in nature. It does not constitute a recommendation to buy or sell any stock, and does not take account of your objectives, or your financial situation. Simply Wall St has no position in the stocks mentioned. Thank you for reading.
