
 Yahoo Finance
 How Much is Safety Insurance Group, Inc.'s (NASDAQ:SAFT) CEO Getting Paid?

George Murphy has been the CEO of Safety Insurance Group, Inc. (NASDAQ:SAFT) since 2016. This analysis aims first to contrast CEO compensation with other companies that have similar market capitalization. Next, we'll consider growth that the business demonstrates. And finally - as a second measure of performance - we will look at the returns shareholders have received over the last few years. This method should give us information to assess how appropriately the company pays the CEO.
Check out our latest analysis for Safety Insurance Group
How Does George Murphy's Compensation Compare With Similar Sized Companies?
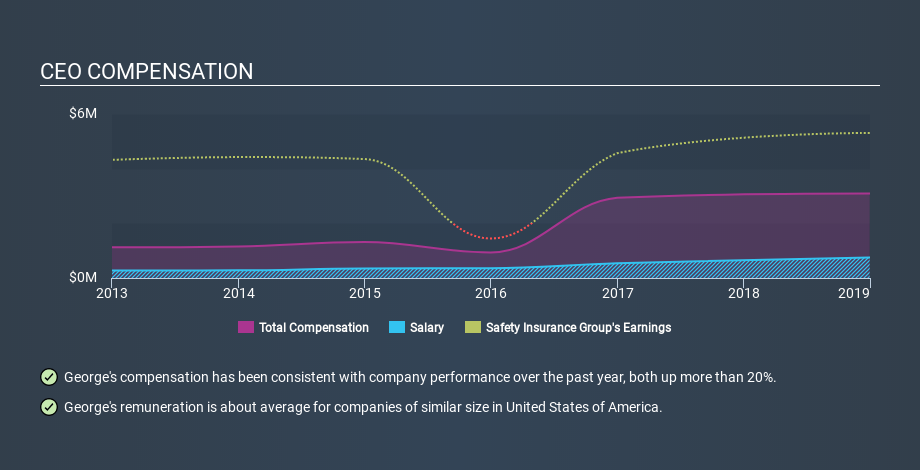
Our data indicates that Safety Insurance Group, Inc. is worth US$1.5b, and total annual CEO compensation was reported as US$3.1m for the year to December 2018. While this analysis focuses on total compensation, it's worth noting the salary is lower, valued at US$750k. We further remind readers that the CEO may face performance requirements to receive the non-salary part of the total compensation. As part of our analysis we looked at companies in the same jurisdiction, with market capitalizations of US$1.0b to US$3.2b. The median total CEO compensation was US$3.9m.
So George Murphy receives a similar amount to the median CEO pay, amongst the companies we looked at. Although this fact alone doesn't tell us a great deal, it becomes more relevant when considered against the business performance.
The graphic below shows how CEO compensation at Safety Insurance Group has changed from year to year.
Is Safety Insurance Group, Inc. Growing?
On average over the last three years, Safety Insurance Group, Inc. has grown earnings per share (EPS) by 17% each year (using a line of best fit). It achieved revenue growth of 1.1% over the last year.
This shows that the company has improved itself over the last few years. Good news for shareholders. It's good to see a bit of revenue growth, as this suggests the business is able to grow sustainably. We don't have analyst forecasts, but you might want to assess this data-rich visualization of earnings, revenue and cash flow.
Has Safety Insurance Group, Inc. Been A Good Investment?
Boasting a total shareholder return of 46% over three years, Safety Insurance Group, Inc. has done well by shareholders. This strong performance might mean some shareholders don't mind if the CEO were to be paid more than is normal for a company of its size.
In Summary...
Remuneration for George Murphy is close enough to the median pay for a CEO of a similar sized company .
Shareholders would surely be happy to see that shareholder returns have been great, and the earnings per share are up. Although the pay is a normal amount, some shareholders probably consider it fair or modest, given the good performance of the stock. CEO compensation is one thing, but it is also interesting to check if the CEO is buying or selling Safety Insurance Group (free visualization of insider trades).
Arguably, business quality is much more important than CEO compensation levels. So check out this free list of interesting companies, that have HIGH return on equity and low debt.
If you spot an error that warrants correction, please contact the editor at editorial-team@simplywallst.com. This article by Simply Wall St is general in nature. It does not constitute a recommendation to buy or sell any stock, and does not take account of your objectives, or your financial situation. Simply Wall St has no position in the stocks mentioned.
We aim to bring you long-term focused research analysis driven by fundamental data. Note that our analysis may not factor in the latest price-sensitive company announcements or qualitative material. Thank you for reading.
