
 Yahoo Finance
 How Much is Idera Pharmaceuticals, Inc.’s (NASDAQ:IDRA) CEO Getting Paid?

Vinnie, Vin Milano became the CEO of Idera Pharmaceuticals, Inc. (NASDAQ:IDRA) in 2014. This analysis aims first to contrast CEO compensation with other companies that have similar market capitalization. After that, we will consider the growth in the business. Third, we’ll reflect on the total return to shareholders over three years, as a second measure of business performance. This process should give us an idea about how appropriately the CEO is paid.
View our latest analysis for Idera Pharmaceuticals
Want to help shape the future of investing tools and platforms? Take the survey and be part of one of the most advanced studies of stock market investors to date.
How Does Vinnie, Vin Milano’s Compensation Compare With Similar Sized Companies?
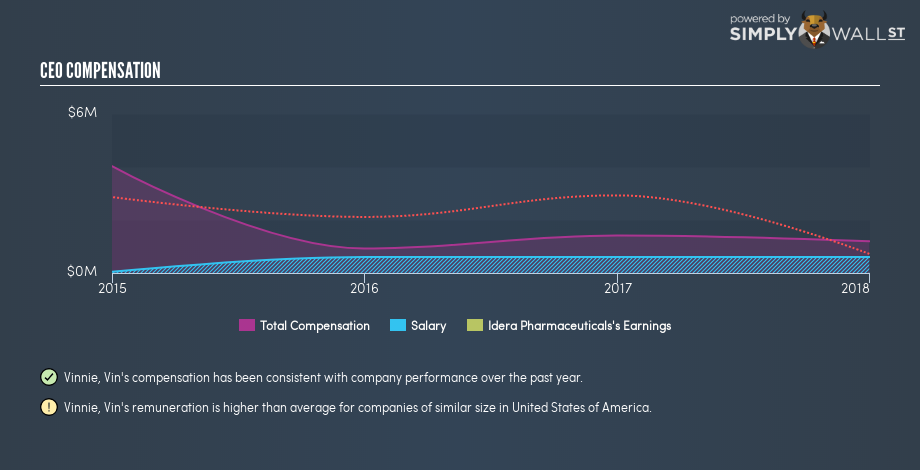
Our data indicates that Idera Pharmaceuticals, Inc. is worth US$99m, and total annual CEO compensation is US$1.2m. (This is based on the year to 2017). While this analysis focuses on total compensation, it’s worth noting the salary is lower, valued at US$600k. We examined a group of similar sized companies, with market capitalizations of below US$200m. The median CEO compensation in that group is US$303k.
It would therefore appear that Idera Pharmaceuticals, Inc. pays Vinnie, Vin Milano more than the median CEO remuneration at companies of a similar size, in the same market. However, this fact alone doesn’t mean the remuneration is too high. We can get a better idea of how generous the pay is by looking at the performance of the underlying business.
You can see a visual representation of the CEO compensation at Idera Pharmaceuticals, below.
Is Idera Pharmaceuticals, Inc. Growing?
On average over the last three years, Idera Pharmaceuticals, Inc. has grown earnings per share (EPS) by 7.6% each year (using a line of best fit). In the last year, its revenue is down -95%.
I generally like to see a little revenue growth, but the improvement in EPS is good. In conclusion we can’t form a strong opinion about business performance yet; but it’s one worth watching.
It could be important to check this free visual depiction of what analysts expect for the future.
Has Idera Pharmaceuticals, Inc. Been A Good Investment?
With a three year total loss of 79%, Idera Pharmaceuticals, Inc. would certainly have some dissatisfied shareholders. This suggests it would be unwise for the company to pay the CEO too generously.
In Summary…
We compared the total CEO remuneration paid by Idera Pharmaceuticals, Inc., and compared it to remuneration at a group of similar sized companies. We found that it pays well over the median amount paid in the benchmark group.
While we have not been overly impressed by the business performance, the shareholder returns, over three years, have been disappointing. Shareholders may wish to consider further research. Although we don’t think the CEO pay is too high, it is probably more on the generous side of things. Shareholders may want to check for free if Idera Pharmaceuticals insiders are buying or selling shares.
Or you could feast your eyes on this interactive graph depicting past earnings, cash flow and revenue.
To help readers see past the short term volatility of the financial market, we aim to bring you a long-term focused research analysis purely driven by fundamental data. Note that our analysis does not factor in the latest price-sensitive company announcements.
The author is an independent contributor and at the time of publication had no position in the stocks mentioned. For errors that warrant correction please contact the editor at editorial-team@simplywallst.com.
