
 Yahoo Finance
 How Much Did RPC, Inc.'s (NYSE:RES) CEO Pocket Last Year?

Want to participate in a short research study? Help shape the future of investing tools and you could win a $250 gift card!
In 2003 Richard Hubbell was appointed CEO of RPC, Inc. (NYSE:RES). This analysis aims first to contrast CEO compensation with other companies that have similar market capitalization. After that, we will consider the growth in the business. And finally - as a second measure of performance - we will look at the returns shareholders have received over the last few years. This method should give us information to assess how appropriately the company pays the CEO.
View our latest analysis for RPC
How Does Richard Hubbell's Compensation Compare With Similar Sized Companies?
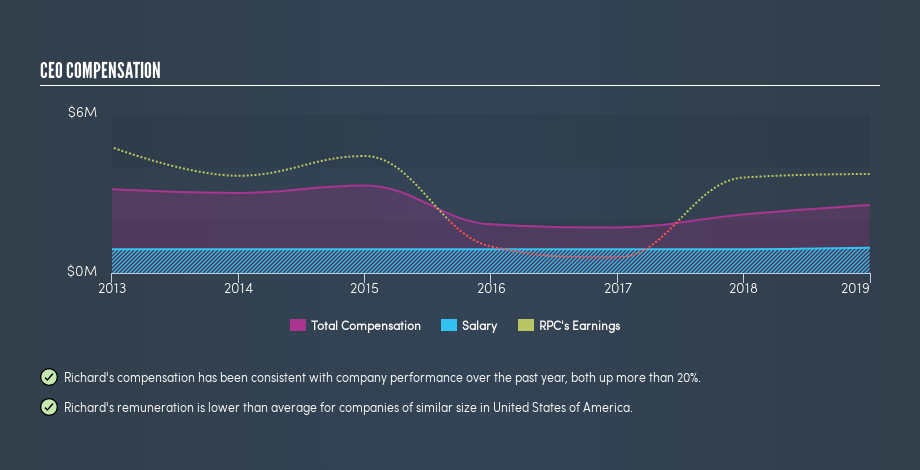
Our data indicates that RPC, Inc. is worth US$1.5b, and total annual CEO compensation is US$2.6m. (This is based on the year to December 2018). We think total compensation is more important but we note that the CEO salary is lower, at US$950k. We examined companies with market caps from US$1.0b to US$3.2b, and discovered that the median CEO total compensation of that group was US$3.9m.
A first glance this seems like a real positive for shareholders, since Richard Hubbell is paid less than the average total compensation paid by similar sized companies. However, before we heap on the praise, we should delve deeper to understand business performance.
You can see, below, how CEO compensation at RPC has changed over time.
Is RPC, Inc. Growing?
On average over the last three years, RPC, Inc. has grown earnings per share (EPS) by 100% each year (using a line of best fit). Its revenue is down -6.6% over last year.
Overall this is a positive result for shareholders, showing that the company has improved in recent years. Revenue growth is a real positive for growth, but ultimately profits are more important. Shareholders might be interested in this free visualization of analyst forecasts.
Has RPC, Inc. Been A Good Investment?
Given the total loss of 53% over three years, many shareholders in RPC, Inc. are probably rather dissatisfied, to say the least. It therefore might be upsetting for shareholders if the CEO were paid generously.
In Summary...
It appears that RPC, Inc. remunerates its CEO below most similar sized companies. Many would consider this to indicate that the pay is modest since the business is growing. Despite some positives, it is likely that shareholders wanted better returns, given the performance over the last three years. So while we would not say that Richard Hubbell is generously paid, it would be good to see an improvement in business performance before too an increase in pay.
When I see fairly low remuneration, combined with earnings per share growth, but without big share price gains, it makes me want to research the potential for future gains. If you think CEO compensation levels are interesting you will probably really like this free visualization of insider trading at RPC.
Important note: RPC may not be the best stock to buy. You might find something better in this list of interesting companies with high ROE and low debt.
We aim to bring you long-term focused research analysis driven by fundamental data. Note that our analysis may not factor in the latest price-sensitive company announcements or qualitative material.
If you spot an error that warrants correction, please contact the editor at editorial-team@simplywallst.com. This article by Simply Wall St is general in nature. It does not constitute a recommendation to buy or sell any stock, and does not take account of your objectives, or your financial situation. Simply Wall St has no position in the stocks mentioned. Thank you for reading.
