
 Yahoo Finance
 How Much Did Frank's International's(NYSE:FI) Shareholders Earn From Share Price Movements Over The Last Five Years?
While it may not be enough for some shareholders, we think it is good to see the Frank's International N.V. (NYSE:FI) share price up 29% in a single quarter. But will that repair the damage for the weary investors who have owned this stock as it declined over half a decade? Probably not. Indeed, the share price is down a whopping 85% in that time. The recent bounce might mean the long decline is over, but we are not confident. The million dollar question is whether the company can justify a long term recovery.
We really feel for shareholders in this scenario. It's a good reminder of the importance of diversification, and it's worth keeping in mind there's more to life than money, anyway.
Check out our latest analysis for Frank's International
Given that Frank's International didn't make a profit in the last twelve months, we'll focus on revenue growth to form a quick view of its business development. Shareholders of unprofitable companies usually expect strong revenue growth. Some companies are willing to postpone profitability to grow revenue faster, but in that case one does expect good top-line growth.
In the last five years Frank's International saw its revenue shrink by 14% per year. That's definitely a weaker result than most pre-profit companies report. So it's not that strange that the share price dropped 13% per year in that period. This kind of price performance makes us very wary, especially when combined with falling revenue. Ironically, that behavior could create an opportunity for the contrarian investor - but only if there are good reasons to predict a brighter future.
The graphic below depicts how earnings and revenue have changed over time (unveil the exact values by clicking on the image).
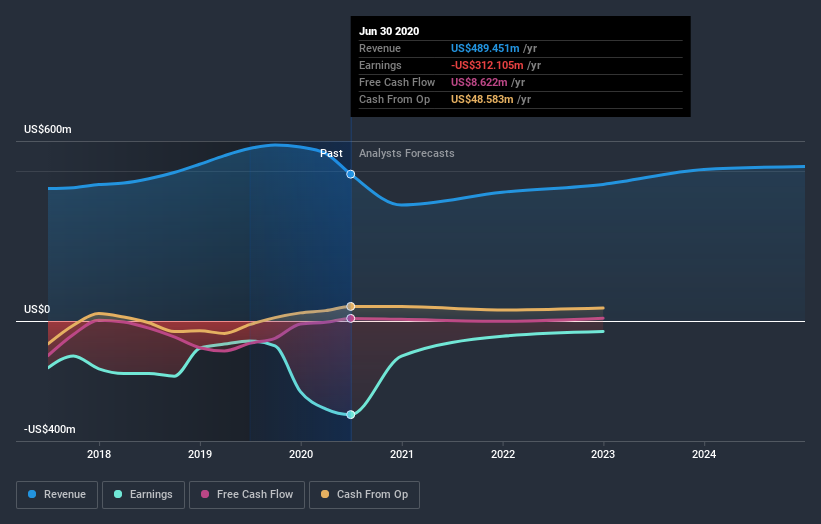
Balance sheet strength is crucial. It might be well worthwhile taking a look at our free report on how its financial position has changed over time.
A Different Perspective
Investors in Frank's International had a tough year, with a total loss of 48%, against a market gain of about 20%. Even the share prices of good stocks drop sometimes, but we want to see improvements in the fundamental metrics of a business, before getting too interested. Regrettably, last year's performance caps off a bad run, with the shareholders facing a total loss of 13% per year over five years. Generally speaking long term share price weakness can be a bad sign, though contrarian investors might want to research the stock in hope of a turnaround. While it is well worth considering the different impacts that market conditions can have on the share price, there are other factors that are even more important. Case in point: We've spotted 2 warning signs for Frank's International you should be aware of.
But note: Frank's International may not be the best stock to buy. So take a peek at this free list of interesting companies with past earnings growth (and further growth forecast).
Please note, the market returns quoted in this article reflect the market weighted average returns of stocks that currently trade on US exchanges.
This article by Simply Wall St is general in nature. It does not constitute a recommendation to buy or sell any stock, and does not take account of your objectives, or your financial situation. We aim to bring you long-term focused analysis driven by fundamental data. Note that our analysis may not factor in the latest price-sensitive company announcements or qualitative material. Simply Wall St has no position in any stocks mentioned.
Have feedback on this article? Concerned about the content? Get in touch with us directly. Alternatively, email editorial-team@simplywallst.com.
