
 Yahoo Finance
 How Much Did Advantage Oil & Gas'(TSE:AAV) Shareholders Earn From Share Price Movements Over The Last Three Years?

This month, we saw the Advantage Oil & Gas Ltd. (TSE:AAV) up an impressive 38%. But only the myopic could ignore the astounding decline over three years. In that time the share price has melted like a snowball in the desert, down 73%. So we're relieved for long term holders to see a bit of uplift. Only time will tell if the company can sustain the turnaround.
See our latest analysis for Advantage Oil & Gas
In his essay The Superinvestors of Graham-and-Doddsville Warren Buffett described how share prices do not always rationally reflect the value of a business. One flawed but reasonable way to assess how sentiment around a company has changed is to compare the earnings per share (EPS) with the share price.
Over the three years that the share price declined, Advantage Oil & Gas' earnings per share (EPS) dropped significantly, falling to a loss. Since the company has fallen to a loss making position, it's hard to compare the change in EPS with the share price change. However, we can say we'd expect to see a falling share price in this scenario.
You can see how EPS has changed over time in the image below (click on the chart to see the exact values).
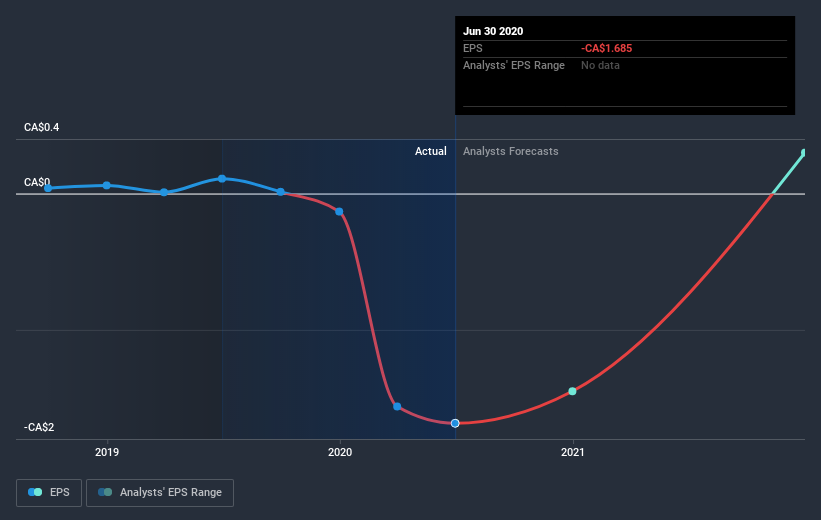
This free interactive report on Advantage Oil & Gas' earnings, revenue and cash flow is a great place to start, if you want to investigate the stock further.
A Different Perspective
It's nice to see that Advantage Oil & Gas shareholders have received a total shareholder return of 49% over the last year. That certainly beats the loss of about 11% per year over the last half decade. We generally put more weight on the long term performance over the short term, but the recent improvement could hint at a (positive) inflection point within the business. It's always interesting to track share price performance over the longer term. But to understand Advantage Oil & Gas better, we need to consider many other factors. To that end, you should learn about the 2 warning signs we've spotted with Advantage Oil & Gas (including 1 which is makes us a bit uncomfortable) .
If you would prefer to check out another company -- one with potentially superior financials -- then do not miss this free list of companies that have proven they can grow earnings.
Please note, the market returns quoted in this article reflect the market weighted average returns of stocks that currently trade on CA exchanges.
This article by Simply Wall St is general in nature. It does not constitute a recommendation to buy or sell any stock, and does not take account of your objectives, or your financial situation. We aim to bring you long-term focused analysis driven by fundamental data. Note that our analysis may not factor in the latest price-sensitive company announcements or qualitative material. Simply Wall St has no position in any stocks mentioned.
Have feedback on this article? Concerned about the content? Get in touch with us directly. Alternatively, email editorial-team@simplywallst.com.
