
 Yahoo Finance
 MSCI Q1 Earnings Beat, Recurring Subscriptions Rise Y/Y
MSCI Inc.'s MSCI first-quarter 2024 adjusted earnings of $3.52 per share beat the Zacks Consensus Estimate by 2.33% and increased 12.1% year over year.
Revenues increased 14.8% year over year to $680 million but missed the consensus mark by 0.38%. Organic revenues increased 10.3% year over year.
Recurring subscriptions of $513.1 million increased 15.2% year over year and accounted for 75% of revenues.
Asset-based fees of $150.3 million increased 12.9% year over year and contributed 21% of revenues.
Non-recurring revenues of $16.7 million surged 20.3% year over year and contributed 2% of revenues.
MSCI Inc Price, Consensus and EPS Surprise
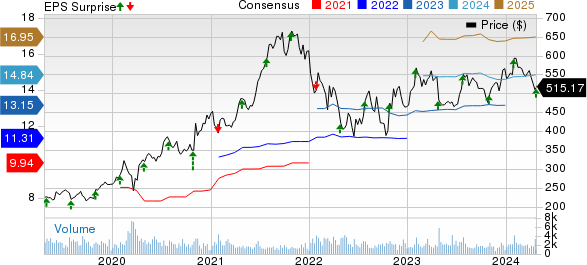
MSCI Inc price-consensus-eps-surprise-chart | MSCI Inc Quote
At the end of the reported quarter, average assets under management (AUM) were $1.582 trillion in ETFs linked to MSCI indexes.
The total retention rate was 92.8% in the quarter under review.
Top-Line Details
In the first quarter, Index revenues of $374 million missed the Zacks Consensus Estimate by 6.3% and increased 10.2% year over year. Recurring subscriptions, asset-based fees and non-recurring revenues increased 8.3%, 12.9% and 11.3% on a year-over-year basis, respectively.
Growth in recurring subscription revenues was primarily driven by strong growth from market-cap-weighted Index products.
Revenues from ETFs linked to MSCI equity indexes, mainly driven by an increase in average AUM, drove more than 70% of the increase in revenues attributable to asset-based fees. The balance of the increase was contributed by non-ETF indexed funds linked to MSCI indexes, driven by an increase in average AUM.
Analytics operating revenues of $164 million beat the consensus mark by 3.3% and increased 11.5% year over year. Organically, Analytics’ operating revenue growth was 11.9%.
Recurring subscriptions and non-recurring revenues increased 11.1% and 33% on a year-over-year basis, respectively.
ESG and Climate segment’s operating revenues of $78 million lagged the consensus mark by 2.67% but increased 16.1% year over year. Organic operating revenue growth was 11%.
Recurring subscriptions and non-recurring revenues increased 16.3% and 10.6% on a year-over-year basis, respectively.
All Other – Private Assets operating revenues, which primarily comprise the Real Assets operating segment and the Private Capital Solutions (formerly known as Burgiss), were $64.2 million, up 66% year over year. The figure missed the consensus mark by 1.37%.
Operating Details
Adjusted EBITDA increased 11.3% year over year to $383.6 million in the reported quarter. Adjusted EBITDA margin contracted 180 basis points (bps) on a year-over-year basis to 56.4%.
Total operating expenses increased 22.7% on a year-over-year basis to $340.6 million.
Adjusted EBITDA expenses were $296.6 million, up 19.8%, primarily reflecting higher compensation and incentive compensation expenses related to higher headcount.
Operating income improved 7.9% year over year to $339.4 million. The operating margin contracted 320 bps on a year-over-year basis to 49.9%.
Balance Sheet & Cash Flow
Total cash and cash equivalents, as of Mar 31, 2024, were $519.3 million compared with $461.7 million as of Dec 31, 2023.
Total debt was $4.5 billion as of Mar 31, unchanged sequentially. The total debt-to-adjusted EBITDA ratio (based on trailing twelve-month-adjusted EBITDA) was 3.9 times, higher than the management’s target range of 3-3.5 times.
Free cash flow was $276 million, up 13.7% year over year.
MSCI had $0.8 billion outstanding under its share-repurchase authorization as of Apr 22, 2024.
It paid out dividends worth $126.8 million in the first quarter.
Guidance
For 2024, MSCI expects total operating expenses in the range of $1.300-$1.340 billion.
Adjusted EBITDA expenses are expected between $1.130 billion and $1.160 billion.
Interest expenses are expected between $185 million and $189 million.
Net cash provided by operating activities and free cash flow is expected to be $1.33-$1.38 billion and $1.225-$1.285 billion, respectively.
Zacks Rank & Stocks to Consider
Currently, MSCI carries a Zacks Rank #3 (Hold).
MSCI shares have underperformed the Zacks Computer & Technology sector year to date. While MSCI shares have declined 15.5%, the Computer & Technology sector has increased 37.4%.
Opera OPRA, Perfect PERF and Pinterest PINS are some better-ranked stocks that investors can consider in the broader sector, each sporting a Zacks Rank #1 (Strong Buy) at present. You can see the complete list of today’s Zacks #1 Rank stocks here.
Opera shares have gained 32.7% year to date. OPRA is set to report its first-quarter 2024 results on Apr 25.
Perfect shares have declined 60.3% year to date. PERF is set to report its first-quarter 2024 results on Apr 24.
Pinterest shares have gained 19.6% year to date. PINS is set to report its first-quarter 2024 results on Apr 30.
Want the latest recommendations from Zacks Investment Research? Today, you can download 7 Best Stocks for the Next 30 Days. Click to get this free report
MSCI Inc (MSCI) : Free Stock Analysis Report
Opera Limited Sponsored ADR (OPRA) : Free Stock Analysis Report
Pinterest, Inc. (PINS) : Free Stock Analysis Report
Perfect Corp. (PERF) : Free Stock Analysis Report
