
 Yahoo Finance
 Do You Like Morguard Corporation (TSE:MRC) At This P/E Ratio?

Want to participate in a short research study? Help shape the future of investing tools and you could win a $250 gift card!
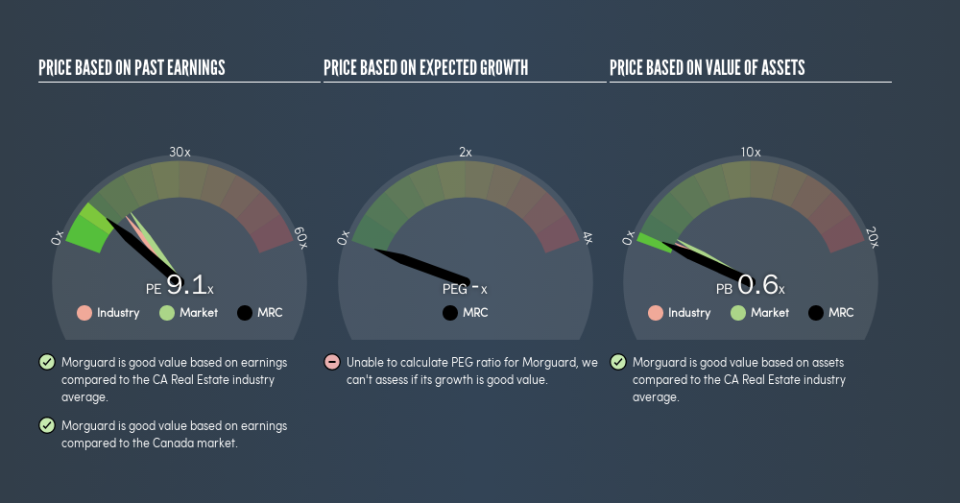
The goal of this article is to teach you how to use price to earnings ratios (P/E ratios). We'll show how you can use Morguard Corporation's (TSE:MRC) P/E ratio to inform your assessment of the investment opportunity. Based on the last twelve months, Morguard's P/E ratio is 9.08. That means that at current prices, buyers pay CA$9.08 for every CA$1 in trailing yearly profits.
View our latest analysis for Morguard
How Do You Calculate A P/E Ratio?
The formula for P/E is:
Price to Earnings Ratio = Share Price ÷ Earnings per Share (EPS)
Or for Morguard:
P/E of 9.08 = CA$189 ÷ CA$20.81 (Based on the year to March 2019.)
Is A High Price-to-Earnings Ratio Good?
A higher P/E ratio implies that investors pay a higher price for the earning power of the business. That is not a good or a bad thing per se, but a high P/E does imply buyers are optimistic about the future.
How Does Morguard's P/E Ratio Compare To Its Peers?
The P/E ratio essentially measures market expectations of a company. We can see in the image below that the average P/E (13.3) for companies in the real estate industry is higher than Morguard's P/E.
Its relatively low P/E ratio indicates that Morguard shareholders think it will struggle to do as well as other companies in its industry classification. While current expectations are low, the stock could be undervalued if the situation is better than the market assumes. If you consider the stock interesting, further research is recommended. For example, I often monitor director buying and selling.
How Growth Rates Impact P/E Ratios
Probably the most important factor in determining what P/E a company trades on is the earnings growth. That's because companies that grow earnings per share quickly will rapidly increase the 'E' in the equation. That means unless the share price increases, the P/E will reduce in a few years. And as that P/E ratio drops, the company will look cheap, unless its share price increases.
Morguard's earnings per share fell by 40% in the last twelve months. But it has grown its earnings per share by 4.3% per year over the last five years.
Remember: P/E Ratios Don't Consider The Balance Sheet
It's important to note that the P/E ratio considers the market capitalization, not the enterprise value. In other words, it does not consider any debt or cash that the company may have on the balance sheet. Theoretically, a business can improve its earnings (and produce a lower P/E in the future) by investing in growth. That means taking on debt (or spending its cash).
Spending on growth might be good or bad a few years later, but the point is that the P/E ratio does not account for the option (or lack thereof).
So What Does Morguard's Balance Sheet Tell Us?
Morguard's net debt is considerable, at 268% of its market cap. This is a relatively high level of debt, so the stock probably deserves a relatively low P/E ratio. Keep that in mind when comparing it to other companies.
The Bottom Line On Morguard's P/E Ratio
Morguard's P/E is 9.1 which is below average (15.1) in the CA market. The P/E reflects market pessimism that probably arises from the lack of recent EPS growth, paired with significant leverage.
When the market is wrong about a stock, it gives savvy investors an opportunity. As value investor Benjamin Graham famously said, 'In the short run, the market is a voting machine but in the long run, it is a weighing machine.' So this free report on the analyst consensus forecasts could help you make a master move on this stock.
Of course you might be able to find a better stock than Morguard. So you may wish to see this free collection of other companies that have grown earnings strongly.
We aim to bring you long-term focused research analysis driven by fundamental data. Note that our analysis may not factor in the latest price-sensitive company announcements or qualitative material.
If you spot an error that warrants correction, please contact the editor at editorial-team@simplywallst.com. This article by Simply Wall St is general in nature. It does not constitute a recommendation to buy or sell any stock, and does not take account of your objectives, or your financial situation. Simply Wall St has no position in the stocks mentioned. Thank you for reading.
