
 Yahoo Finance
 Is There More Growth In Store For Trip.com Group's (NASDAQ:TCOM) Returns On Capital?

If we want to find a stock that could multiply over the long term, what are the underlying trends we should look for? One common approach is to try and find a company with returns on capital employed (ROCE) that are increasing, in conjunction with a growing amount of capital employed. Ultimately, this demonstrates that it's a business that is reinvesting profits at increasing rates of return. So when we looked at Trip.com Group (NASDAQ:TCOM) and its trend of ROCE, we really liked what we saw.
Return On Capital Employed (ROCE): What is it?
If you haven't worked with ROCE before, it measures the 'return' (pre-tax profit) a company generates from capital employed in its business. Analysts use this formula to calculate it for Trip.com Group:
Return on Capital Employed = Earnings Before Interest and Tax (EBIT) ÷ (Total Assets - Current Liabilities)
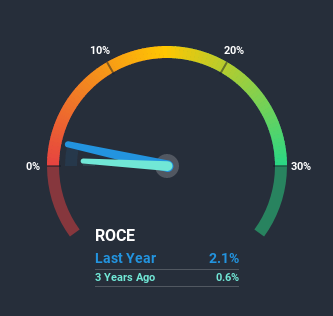
0.021 = CN¥2.6b ÷ (CN¥197b - CN¥68b) (Based on the trailing twelve months to March 2020).
Therefore, Trip.com Group has an ROCE of 2.1%. In absolute terms, that's a low return and it also under-performs the Online Retail industry average of 9.5%.
Check out our latest analysis for Trip.com Group
In the above chart we have measured Trip.com Group's prior ROCE against its prior performance, but the future is arguably more important. If you'd like to see what analysts are forecasting going forward, you should check out our free report for Trip.com Group.
What The Trend Of ROCE Can Tell Us
We're delighted to see that Trip.com Group is reaping rewards from its investments and is now generating some pre-tax profits. About five years ago the company was generating losses but things have turned around because it's now earning 2.1% on its capital. Not only that, but the company is utilizing 576% more capital than before, but that's to be expected from a company trying to break into profitability. This can indicate that there's plenty of opportunities to invest capital internally and at ever higher rates, both common traits of a multi-bagger.
Our Take On Trip.com Group's ROCE
In summary, it's great to see that Trip.com Group has managed to break into profitability and is continuing to reinvest in its business. And given the stock has remained rather flat over the last five years, there might be an opportunity here if other metrics are strong. That being the case, research into the company's current valuation metrics and future prospects seems fitting.
If you want to know some of the risks facing Trip.com Group we've found 2 warning signs (1 is a bit unpleasant!) that you should be aware of before investing here.
While Trip.com Group isn't earning the highest return, check out this free list of companies that are earning high returns on equity with solid balance sheets.
This article by Simply Wall St is general in nature. It does not constitute a recommendation to buy or sell any stock, and does not take account of your objectives, or your financial situation. We aim to bring you long-term focused analysis driven by fundamental data. Note that our analysis may not factor in the latest price-sensitive company announcements or qualitative material. Simply Wall St has no position in any stocks mentioned.
Have feedback on this article? Concerned about the content? Get in touch with us directly. Alternatively, email editorial-team@simplywallst.com.
