
 Yahoo Finance
 More Americans Can Afford To Buy a Home in These 20 Cities

Homeownership is a dream for many Americans, yet for those watching the market burn hot and expensive for the past few years, it may seem out of reach. With the median household income in the U.S. at $70,784, according to the U.S. Census Bureau’s 2021 American Community Survey, picking the right location where homes are affordable is key. But your income doesn’t have to be that high to buy a home. Instead, unlocking the locations of the most affordable housing can help you achieve your dream of homeownership.
O Canada! These 30 Famous Canadians Are Richer Than You Think
P Diddy’s Bad Boy Reunion Concert: Notorious B.I.G. Net Worth, Faith Evans Net Worth and More
GOBankingRates looked at the change in median list prices for homes from 2022 to 2023 using data from Zillow, as well as the year-over-year change in median household income from 2020 to 2021, to determine the most affordable places to buy a home in America.

Chicago
Income Change: 5.93%
Home Price Change: 2.05%
While home values did rise by a bit more than 2%, median incomes also increased in Chicago, which sets up buyers to be in a good position to afford a home here.
Stimulus Update: Double Check Your Mail, Minnesota’s Tax Rebate Looks Like Junk
Food Stamps: What Is The Maximum SNAP EBT Benefits for 2023?

Houston
Income Change: 4.51%
Home Price Change: 2.34%
In Miami the median home price rose from $304,001.64 to $310,222.52 over the past year. However, average income earners also made a bit more money between 2021 and 2022. cheaper.
I’m a Financial Planning Expert: 6 Worst Purchases To Make in an Economic Downturn
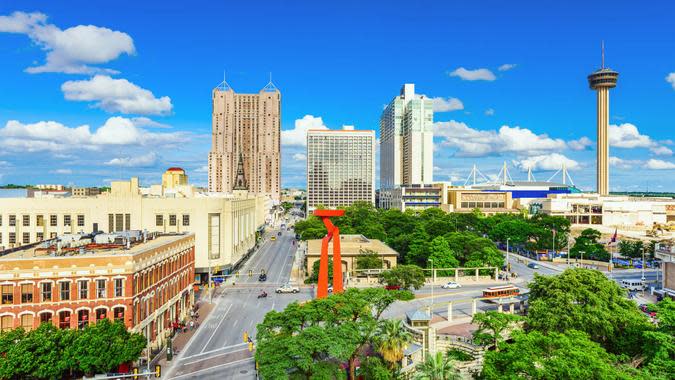
San Antonio
Income Change: 3.11%
Home Price Change: 2.40%
San Antonio’s home values have increased from $287,490.39 to $294,397.75. However, median incomes have also increased, from $53,420 to $55,084.

Philadelphia
Income Change: -4.87%
Home Price Change: 4.98%
Philadelphia may not seem at first glance to be a great place, given that home values have risen, and median income has dropped, but the 2023 home value is still below the national average, at $338,502.17.

Pittsburgh
Income Change: 7.46%
Home Price Change: -0.01%
Pittsburgh is an excellent choice, since not only did house prices drop a bit, average income rose.

Nashville, Tennessee
Income Change: 2.73%
Home Price Change: 1.07%
Nashville’s home prices saw a slight increase in price from $429,657.25 to $434,271.92 but median income also took a jump from $33,302 to $34,211.
These 5 Countries are Almost Inflation-less: Cheap Living with High Salaries

Raleigh, North Carolina
Income Change: 3.71%
Home Price Change: 0.69%
In Raleigh, the home price jumped by less than $3,000 but the median income also jumped by nearly 4%.
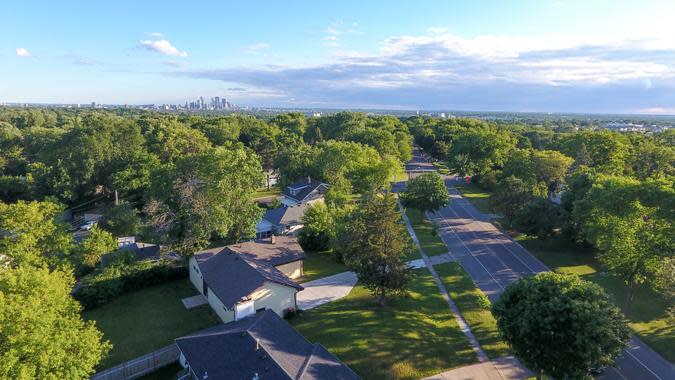
Minneapolis, Minnesota
Income Change: 4.87%
Home Price Change: -0.32%
In Minneapolis, the housing price fell by about $1,200, but the median income grew by $2,561.
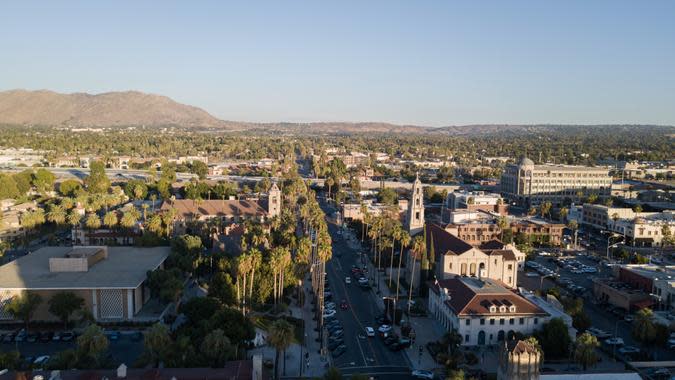
Riverside, California
Income Change: 6.96%
Home Price Change: -1.36%
In Riverside, the home prices fell from $560,499.90 to $552,876.72. However, the median income rose by more than $3,000.

New Orleans
Income Change: 5.06%
Home Price Change: 4.58%
The current average home price of $236,434.08 in New Orleans is quite a bit lower than the median home price of $363,000 (as of February, 2023), according to CNN. Additionally, incomes jumped by over $2,300 here.
Side Gig: Earn Up To $200/Hour With This Easy-To-Start Job, No College Degree Required

Dallas
Income Change: 1.32%
Home Price Change: 0.29%
Home prices rose by a negligible amount here in Dallas, from $374,453.99 to $375,555.05. While median incomes also grew minimally, home prices are still quite affordable overall here.

Denver
Income Change: 7.59%
Home Price Change: -3.25%
In Denver, home prices have dropped from $632,225.72 to $611,672.53. With incomes climbing nearly 8%, this bodes well for buying a home.

San Diego
Income Change: 7.19%
Home Price Change: -3.57%
Home prices have dropped significantly in San Diego, more than $30,000. Yet incomes have jumped by more than $6,000.

Los Angeles
Income Change: 6.87%
Home Price Change: -3.50%
Home prices have dropped more than $33,000 in the City of Angels, a boon for potential home buyers, where the median income has increased nearly 7%.
Warren Buffett’s Financial Plan to Tackle America’s Debt: ‘I Can End the Deficit in 5 Minutes’

Phoenix
Income Change: 6.59%
Home Price Change: -3.42%
Phoenix home prices have dropped nearly $16,000 over the past year. Median incomes, however, have risen over $4,000.

Las Vegas
Income Change: 5.10%
Home Price Change: -3.22%
Though Las Vegas attracts a lot of tourists, it’s also a good place to become a resident, with home prices dropping from $428,340.43 to $414,566.59. Median income has risen, from $58,377 to $61,356.

Salt Lake City
Income Change: 4.31%
Home Price Change: -3.06%
The capital of Utah is a decent place to buy a home right now, with housing prices having dropped $more than $17,000 in the past year. Median income has increased from $63,156 to $65,880, as well.

Seattle
Income Change: 8.44%
Home Price Change: -5.66%
This pacific northwestern city has seen a significant price drop of over $43,000. However income has risen nicely above 8% increase, or over $8,200.
Capital Gains Tax on Stocks: What It Is and How To Minimize It

Sacramento, California
Income Change: 7.94%
Home Price Change: -5.81%
California’s capital city has also watched home prices drop, by almost $35,000. Median income has increased by more than $5,200.

Austin
Income Change: 2.91%
Home Price Change: -6.74%
Austin’s home prices dropped by over $35,000 in the past year. Incomes rose slightly, from $76,648 to $78,878.
Cynthia Measom contributed to this article.
Methodology: GOBankingRates determined the top places in the US someone can afford a home by using the following factors; (1) April 2023 Median Home Price, (2) April 2022 Median Home Price, sourced from Zillow’s Data Index, (3) 2021 Median Household Income, (4) 2020 Median Household Income, sourced from the 2021 and 2020 American Consumer Survey’s in the US Census. GoBankingRates calculated the Year-over-Year change in median home prices as well as the yea- over-year change in median household income. Both of these were scored and the scores were combined to rank the individuals places. All information is up-to-date as-of May 16th, 2023.
Photo Disclaimer: Please note photos are for representational purposes only. As a result, some of the photos might not reflect the locations listed in this article.
More From GOBankingRates
This article originally appeared on GOBankingRates.com: More Americans Can Afford To Buy a Home in These 20 Cities
