
 Yahoo Finance
 Molson Coors Canada's (TSE:TPX.B) Returns On Capital Not Reflecting Well On The Business
What financial metrics can indicate to us that a company is maturing or even in decline? Businesses in decline often have two underlying trends, firstly, a declining return on capital employed (ROCE) and a declining base of capital employed. This combination can tell you that not only is the company investing less, it's earning less on what it does invest. And from a first read, things don't look too good at Molson Coors Canada (TSE:TPX.B), so let's see why.
What is Return On Capital Employed (ROCE)?
Just to clarify if you're unsure, ROCE is a metric for evaluating how much pre-tax income (in percentage terms) a company earns on the capital invested in its business. To calculate this metric for Molson Coors Canada, this is the formula:
Return on Capital Employed = Earnings Before Interest and Tax (EBIT) ÷ (Total Assets - Current Liabilities)
0.0013 = US$12m ÷ (US$10b - US$1.4b) (Based on the trailing twelve months to September 2020).
Therefore, Molson Coors Canada has an ROCE of 0.1%. Ultimately, that's a low return and it under-performs the Beverage industry average of 12%.
Check out our latest analysis for Molson Coors Canada
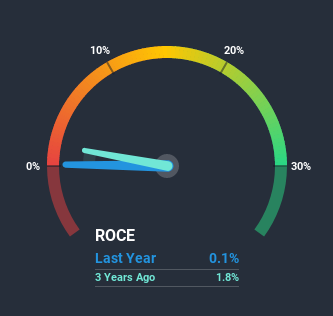
Historical performance is a great place to start when researching a stock so above you can see the gauge for Molson Coors Canada's ROCE against it's prior returns. If you'd like to look at how Molson Coors Canada has performed in the past in other metrics, you can view this free graph of past earnings, revenue and cash flow.
What Can We Tell From Molson Coors Canada's ROCE Trend?
There is reason to be cautious about Molson Coors Canada, given the returns are trending downwards. Unfortunately the returns on capital have diminished from the 1.3% that they were earning five years ago. Meanwhile, capital employed in the business has stayed roughly the flat over the period. Companies that exhibit these attributes tend to not be shrinking, but they can be mature and facing pressure on their margins from competition. So because these trends aren't typically conducive to creating a multi-bagger, we wouldn't hold our breath on Molson Coors Canada becoming one if things continue as they have.
What We Can Learn From Molson Coors Canada's ROCE
In summary, it's unfortunate that Molson Coors Canada is generating lower returns from the same amount of capital. It should come as no surprise then that the stock has fallen 42% over the last five years, so it looks like investors are recognizing these changes. Unless there is a shift to a more positive trajectory in these metrics, we would look elsewhere.
Like most companies, Molson Coors Canada does come with some risks, and we've found 1 warning sign that you should be aware of.
While Molson Coors Canada isn't earning the highest return, check out this free list of companies that are earning high returns on equity with solid balance sheets.
This article by Simply Wall St is general in nature. It does not constitute a recommendation to buy or sell any stock, and does not take account of your objectives, or your financial situation. We aim to bring you long-term focused analysis driven by fundamental data. Note that our analysis may not factor in the latest price-sensitive company announcements or qualitative material. Simply Wall St has no position in any stocks mentioned.
Have feedback on this article? Concerned about the content? Get in touch with us directly. Alternatively, email editorial-team (at) simplywallst.com.