
 Yahoo Finance
 Molson Coors Canada (TSE:TPX.B) Could Be Struggling To Allocate Capital
To avoid investing in a business that's in decline, there's a few financial metrics that can provide early indications of aging. Businesses in decline often have two underlying trends, firstly, a declining return on capital employed (ROCE) and a declining base of capital employed. Trends like this ultimately mean the business is reducing its investments and also earning less on what it has invested. And from a first read, things don't look too good at Molson Coors Canada (TSE:TPX.B), so let's see why.
What is Return On Capital Employed (ROCE)?
For those that aren't sure what ROCE is, it measures the amount of pre-tax profits a company can generate from the capital employed in its business. The formula for this calculation on Molson Coors Canada is:
Return on Capital Employed = Earnings Before Interest and Tax (EBIT) ÷ (Total Assets - Current Liabilities)
0.0013 = US$12m ÷ (US$10b - US$1.4b) (Based on the trailing twelve months to September 2020).
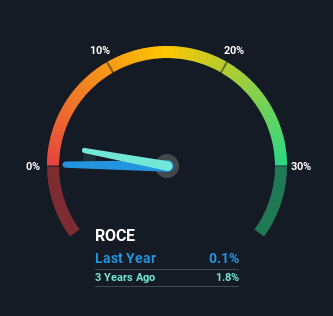
Therefore, Molson Coors Canada has an ROCE of 0.1%. Ultimately, that's a low return and it under-performs the Beverage industry average of 12%.
Check out our latest analysis for Molson Coors Canada
While the past is not representative of the future, it can be helpful to know how a company has performed historically, which is why we have this chart above. If you're interested in investigating Molson Coors Canada's past further, check out this free graph of past earnings, revenue and cash flow.
What Can We Tell From Molson Coors Canada's ROCE Trend?
There is reason to be cautious about Molson Coors Canada, given the returns are trending downwards. About five years ago, returns on capital were 1.3%, however they're now substantially lower than that as we saw above. On top of that, it's worth noting that the amount of capital employed within the business has remained relatively steady. This combination can be indicative of a mature business that still has areas to deploy capital, but the returns received aren't as high due potentially to new competition or smaller margins. So because these trends aren't typically conducive to creating a multi-bagger, we wouldn't hold our breath on Molson Coors Canada becoming one if things continue as they have.
Our Take On Molson Coors Canada's ROCE
In summary, it's unfortunate that Molson Coors Canada is generating lower returns from the same amount of capital. It should come as no surprise then that the stock has fallen 49% over the last five years, so it looks like investors are recognizing these changes. Unless there is a shift to a more positive trajectory in these metrics, we would look elsewhere.
Molson Coors Canada does have some risks, we noticed 3 warning signs (and 2 which make us uncomfortable) we think you should know about.
While Molson Coors Canada may not currently earn the highest returns, we've compiled a list of companies that currently earn more than 25% return on equity. Check out this free list here.
Have feedback on this article? Concerned about the content? Get in touch with us directly. Alternatively, email editorial-team (at) simplywallst.com.
This article by Simply Wall St is general in nature. We provide commentary based on historical data and analyst forecasts only using an unbiased methodology and our articles are not intended to be financial advice. It does not constitute a recommendation to buy or sell any stock, and does not take account of your objectives, or your financial situation. We aim to bring you long-term focused analysis driven by fundamental data. Note that our analysis may not factor in the latest price-sensitive company announcements or qualitative material. Simply Wall St has no position in any stocks mentioned.
