
 Yahoo Finance
 Can Mixed Fundamentals Have A Negative Impact on Superior Group of Companies, Inc. (NASDAQ:SGC) Current Share Price Momentum?
Most readers would already be aware that Superior Group of Companies' (NASDAQ:SGC) stock increased significantly by 23% over the past three months. But the company's key financial indicators appear to be differing across the board and that makes us question whether or not the company's current share price momentum can be maintained. In this article, we decided to focus on Superior Group of Companies' ROE.
Return on Equity or ROE is a test of how effectively a company is growing its value and managing investors’ money. In short, ROE shows the profit each dollar generates with respect to its shareholder investments.
See our latest analysis for Superior Group of Companies
How Do You Calculate Return On Equity?
Return on equity can be calculated by using the formula:
Return on Equity = Net Profit (from continuing operations) ÷ Shareholders' Equity
So, based on the above formula, the ROE for Superior Group of Companies is:
4.4% = US$8.8m ÷ US$198m (Based on the trailing twelve months to December 2023).
The 'return' is the yearly profit. Another way to think of that is that for every $1 worth of equity, the company was able to earn $0.04 in profit.
What Is The Relationship Between ROE And Earnings Growth?
We have already established that ROE serves as an efficient profit-generating gauge for a company's future earnings. Depending on how much of these profits the company reinvests or "retains", and how effectively it does so, we are then able to assess a company’s earnings growth potential. Generally speaking, other things being equal, firms with a high return on equity and profit retention, have a higher growth rate than firms that don’t share these attributes.
A Side By Side comparison of Superior Group of Companies' Earnings Growth And 4.4% ROE
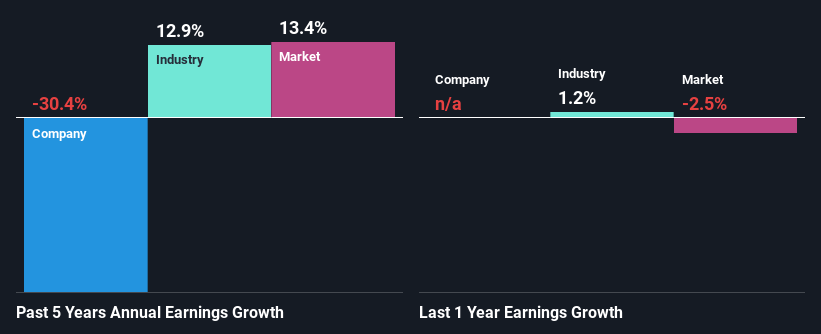
At first glance, Superior Group of Companies' ROE doesn't look very promising. We then compared the company's ROE to the broader industry and were disappointed to see that the ROE is lower than the industry average of 13%. Given the circumstances, the significant decline in net income by 30% seen by Superior Group of Companies over the last five years is not surprising. However, there could also be other factors causing the earnings to decline. For example, it is possible that the business has allocated capital poorly or that the company has a very high payout ratio.
That being said, we compared Superior Group of Companies' performance with the industry and were concerned when we found that while the company has shrunk its earnings, the industry has grown its earnings at a rate of 13% in the same 5-year period.
Earnings growth is a huge factor in stock valuation. The investor should try to establish if the expected growth or decline in earnings, whichever the case may be, is priced in. Doing so will help them establish if the stock's future looks promising or ominous. One good indicator of expected earnings growth is the P/E ratio which determines the price the market is willing to pay for a stock based on its earnings prospects. So, you may want to check if Superior Group of Companies is trading on a high P/E or a low P/E, relative to its industry.
Is Superior Group of Companies Making Efficient Use Of Its Profits?
Superior Group of Companies' low three-year median payout ratio of 11% (implying that it retains the remaining 89% of its profits) comes as a surprise when you pair it with the shrinking earnings. This typically shouldn't be the case when a company is retaining most of its earnings. So there could be some other explanations in that regard. For example, the company's business may be deteriorating.
In addition, Superior Group of Companies has been paying dividends over a period of at least ten years suggesting that keeping up dividend payments is way more important to the management even if it comes at the cost of business growth.
Summary
Overall, we have mixed feelings about Superior Group of Companies. Even though it appears to be retaining most of its profits, given the low ROE, investors may not be benefitting from all that reinvestment after all. The low earnings growth suggests our theory correct. Having said that, looking at current analyst estimates, we found that the company's earnings growth rate is expected to see a huge improvement. To know more about the latest analysts predictions for the company, check out this visualization of analyst forecasts for the company.
Have feedback on this article? Concerned about the content? Get in touch with us directly. Alternatively, email editorial-team (at) simplywallst.com.
This article by Simply Wall St is general in nature. We provide commentary based on historical data and analyst forecasts only using an unbiased methodology and our articles are not intended to be financial advice. It does not constitute a recommendation to buy or sell any stock, and does not take account of your objectives, or your financial situation. We aim to bring you long-term focused analysis driven by fundamental data. Note that our analysis may not factor in the latest price-sensitive company announcements or qualitative material. Simply Wall St has no position in any stocks mentioned.
